Path to Herd Immunity Normality : 2021 Outlook of COVID-19 in the US
By: Youyang Gu
Last Updated: April 26, 2021 (Model last updated: March 5, 2021; First posted December 9, 2020)
Note: Our last model update was in March 2021. We are no longer updating this page. Read more from Youyang here.
With the availability of the COVID-19 vaccine, we present our best estimate of the path to COVID-19 herd immunity / normality in the United States. Immunity against the SARS-CoV-2 virus comes from two sources: vaccination and natural infection. On this page, we provide the latest COVID-19 vaccine projections and current vaccination progress.
June 24, 2021 Note: See our new COVID-19 Population Immunity Calculator. This calculator estimates the true proportion of a population that have immunity against COVID-19, factoring both immunity from vaccination and natural infection. This is the basis for the computation of total immunity in this model.
April 26, 2021 Update: Scroll down or click here to see a comparison of our last projections from March 5 to what actually happened.
April 21, 2021 Note: We uploaded historical daily CDC vaccination data here. It contains the raw data released by the CDC on each date. This has no look-ahead bias, so it is especially useful for training models.
April 13, 2021 Note: Recent delays such as the halting of the Johnson & Johnson vaccine and the ruining of 15 million J&J doses in March mean that actual vaccinations may slightly lag our final projections. On the positive end, the general adult population in all 50 states will be able to receive the vaccine by the end of April, matching our projections from January.
March 8, 2021 Update: We have ended our daily updates for covid19-projections.com and hence are no longer be updating this page. Read Youyang’s One Year Later blog post for a detailed explanation and for a list of alternate resources. You can view the latest vaccination trends on the CDC website. Thank you for your support over the past year.
February 24, 2021 Update: See our latest thoughts on when to expect a return to normal.
February 11, 2021 Update: We changed the page title from “Path to Herd Immunity” to “Path to Normality”. Our modeling suggests that it is increasingly unlikely that we will reach theoretical herd immunity in 2021. See our Feb 11 thread on why the recent attention to herd immunity is overblown, and why we should shift our focus away towards normality instead.
Last updated - Path to Normality plots: Fri, Mar 5 2021 3am ET
Note: Our infections estimates include all new infected individuals of the SARS-CoV-2 virus, not just those that took a COVID-19 test and tested positive. As of January 2021, we estimate the true number of infected individuals in the US to be roughly 2-4x higher than the reported cases (25-50% detection rate). See our writeup, Estimating True Infections, for a more detailed look into this subject.
Note #2: We stopped updating CDC vaccination data on March 8, 2021. For the latest time series, visit the CDC website or our GitHub. See our old plots through March 8 here.
Comparison: Projected vs Actual
Below is a comparison of our last vaccination projection on March 5, 2021 with what happened since. Our vaccination numbers come from the CDC. You can download our final vaccinations projections here. We initially also included a comparison of true infections, but due to the rise of the Delta variant, our original methodology for estimating true infections by applying a prevalence ratio is no longer applicable.
Comparison last updated: Wed, Jan 26 2022 1am ET
Public health messaging should be clear and consistent
As the below example shows, this has not always been the case:
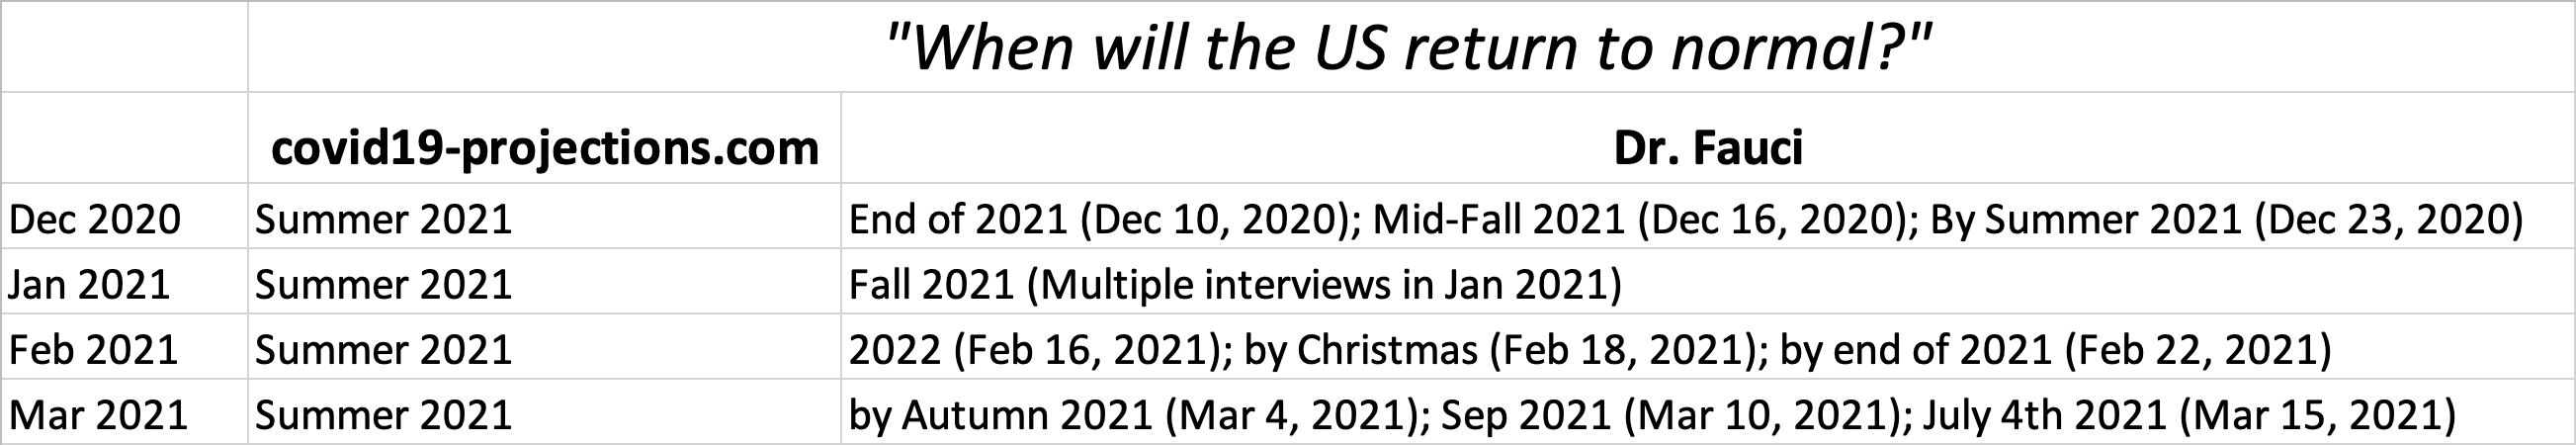
We define “normality” as the removal of all restrictions for the majority of US states.
Table of Contents
Note: All of the projections, results and assumptions below have not been changed since March 8, 2021.
- Summary
- Relevant Twitter Threads
- Disclaimers
- Data
- Assumptions
- Corollaries
- Helpful Data Sources
- Questions? Comments? Feedback?
- Past Updates
Summary
- Every adult who wants to get a vaccine will be able to get a vaccine by May/June 2021.
- The US will be near COVID-19 herd immunity by summer 2021 (Jun-Aug 2021). At a high level, herd immunity is a concept in which a population can be protected from a virus if enough people possess immunity. Current accepted estimates for the herd immunity threshold range from 60-90% of the population.
- Due to vaccine hesitancy and the later arrival of a children’s vaccine, it is possible that we do not reach the levels required for herd immunity in 2021. Nevertheless, herd immunity is not a hard threshold, and being close to herd immunity may be sufficient to prevent large outbreaks.
- At the time herd immunity is near, roughly half of the immunity will be achieved through natural infection, and the other half will be achieved through vaccination.
- New infections may become minimal before herd immunity is reached. But due to imported cases and localized clusters, it is unlikely that new infections will drop to zero until at least 2022.
- Deaths may drop to low levels even earlier (May-Jul 2021), in part due to a vaccine distribution strategy that initially prioritizes high-risk individuals. Once deaths fall to minimal levels, we may see a relaxation of restrictions.
- Summarizing the above findings, our best estimate of a “return to normal” in the US is summer 2021 (June-August 2021). We define normality as the removal of all COVID-19-related restrictions for the majority of US states.
- We estimate roughly 60-70% of the US population (~220 million) will receive at least one dose of the vaccine by the end of 2021, with children being the last group to receive it (starting in summer 2021 or later).
- We estimate around 30-35% of the US population (100-120 million) will have been infected by the SARS-CoV-2 virus by the end of 2021. That is an additional ~50 million infections since mid-December 2020.
- This translates to a final US COVID-19 death toll of roughly 600,000 (±100,000) reported deaths by end of 2021, or ~300,000 additional deaths since mid-December 2020.
Relevant Twitter Threads
See our Twitter Threads page.
Disclaimers
- The author is a data scientist and is not an epidemiologist, an immunologist, or a public health expert.
- This writeup has not been peer-reviewed in an academic journal.
- Only publicly available data are used.
- There is a very high amount of uncertainty with any model that makes outlooks for 6-12 months out. We fully acknowledge the possibility that these results may not reflect reality. The results presented here are merely estimates based on a set of assumptions (listed below), so please use caution when utilizing the results.
- For the majority of the assumptions, the exact numerical values have relatively minor impacts on the final results.
- If any of the assumptions used to generate these estimates do not hold, then the results may be drastically different.
- These are the best estimates given what is known at the time this was written, but are subject to change based on new data/evidence. For example, if vaccine rollout and uptake is quicker than estimated, then we may reach herd immunity sooner. If rollout and uptake is slower than estimated, we may reach herd immunity later.
- While we have estimates for when we expect a “return to normal”, the ultimate decision to relax restrictions lies in the hands of the local, state, and federal governments. Therefore, it is likely that restrictions may be relaxed sooner or later than the estimates.
- From ‘Herd Immunity’: A Rough Guide: “[We must] be wary of target thresholds for vaccination, insofar as thresholds are based on assumptions that greatly simplify the complexity of actual populations. In most circumstances, the sensible public health practice is to aim for 100% coverage, with all the doses recommended, recognizing that 100% is never achievable, hoping to reach whatever is the ‘real’ herd immunity threshold in the population concerned.”
Data
We use vaccination data from the Centers for Disease Control and Prevention (CDC). We upload the raw and adjusted CDC vaccination time series datafor download on GitHub. It contains daily CDC vaccination updates since they started releasing data on Dec 20, 2020.
While we release daily past infections estimates for every state and county, we are currently not releasing our vaccination and infections forecasts. This is due to 1) the limitations and noisiness in the existing data 2) the high degree of uncertainty for the future and 3) the reliance on numerous assumptions (outlined below). As a result, we believe these projections are best suited to be viewed in the context of everything outlined on this page, and should best not be used independently. Without all the necessary context/assumptions, the results can easily be misinterpreted.
You can download our final vaccinations projections from March 5, 2021 here.
Assumptions
The underlying assumptions behind our estimates are presented below:
Basic Assumptions
- Important: The only SARS-CoV-2 variant we are currently modeling is the B.1.1.7 variant that was first detected in the UK (see Jan 11 update below). If other variants become more prevalent in the US, these estimates may no longer hold. We are monitoring for more data regarding the other variants.
- We assume immunity can be achieved through either natural infection or vaccination. We assume this immunity can be lost over time.
- We assume herd immunity is near when at least 60-80% of the population possess immunity from the SARS-CoV-2 virus. This corresponds to roughly 200-260 million individuals in the US. Due to population heterogeneity, variation in susceptibility and/or pre-existing immunity, it is possible that the herd immunity threshold (HIT) can be lower. But HIT can also be higher due to a higher transmissibility of virus variants and the targeted approach of vaccine distribution (e.g. individuals with the greatest impact on transmission are vaccinated last).
- We assume states will continue to impose varying degrees of restrictions and interventions until hospitalizations and deaths drop to low levels. The exact thresholds will depend on each state.
- We define “normality” as the removal of all COVID-19-related restrictions and interventions.
- Herd immunity is not permanent. It can be lost due to waning immunity, both from infection and vaccination.
- For the purpose of estimating new infections, we do not differentiate between immunity acquired from infection and immunity acquired from vaccination.
Vaccination Assumptions
- We count an individual as vaccinated after they receive the first dose. We assume it takes three weeks after the first dose for an individual to gain immunity.
- Our initial model factors in the rollout of two vaccines: Pfizer and Moderna. In February, we began also factoring in the rollout of the single-dose Johnson & Johnson vaccine beginning in March. More vaccines may be approved in 2021 (e.g. AstraZeneca), but the exact timelines are still unclear. We will incorporate additional vaccines as more data becomes available.
- We assume a proportion of the vaccinated population already possesses immunity via infection. For simplicity, we assume individuals who already possess immunity from natural infection will get vaccinated at the same rate as susceptible individuals.
- We assume roughly 60-70% of the US population (~220 million) will take at least one dose of the vaccine by the end of 2021. This is based on recent surveys. This is higher than the ~50% vaccine coverage for the common flu.
- We assume the majority of individuals (but not all) will receive the second dose.
- We assume the general population will begin receiving vaccinations in late spring (Apr-May 2021).
- We assume children will begin receiving vaccinations in summer or fall 2021. It is possible that a vaccine for the youngest age group (ages 0-5) will not be available in 2021.
- We assume a 85% vaccine efficacy (changed from 90% on Feb 4, 2021 and 85% on Jan 21, 2021). Hence, if 100 individuals are vaccinated, we assume 85 will develop immunity and 15 will not. While the trial data for Pfizer and Moderna demonstrate ~95% efficacy, we believe that the efficacy in the general population will be slightly lower, mainly due to the fact that a non-insignificant proportion of the population may miss the second vaccine dose. We are also workign to better incorporate the efficacy of the J&J vaccine, pending more data.
- We assume the vaccine is effective on the new B.1.17 SARS-CoV-2 variant (preliminary research here and here).
- We assume that if effective, the vaccine will provide individuals immunity through at least 2021.
- While it is still unclear to the extent to which the vaccine provides sterilizing immunity, we assume that the vaccine, if effective, can provide functional immunity for the individual and significantly reduce their likelihood of being infectious for at least the duration of 2021 (preliminary research from AstraZeneca here and Pfizer here or here).
- We assume vaccinations will begin in mid-December following the FDA Emergency Use Authorization (EUA) approval. Due to distribution issues, constraints with storage, and vaccine hesitancy, we believe the initial rollout will be slower than Operation Warp Speed’s estimates of 20 million doses by end of 2020.
- Many of the assumptions in this writeup come from the December 10 FDA Briefing Document for the Pfizer vaccine.
- We assume a smooth but conservative vaccine rollout, with no major issues or halts. If rollout and uptake is quicker than estimated, then we may reach herd immunity sooner. If rollout and uptake is slower than estimated, we may reach herd immunity later.
- We assume that at its peak, around 3 million doses will be given per day (enough for innoculate ~2 million people). This is roughly equal to the peak vaccine distribution for influenza (~3 million doses per day).
Infection Assumptions
- Important: The only SARS-CoV-2 variant we are currently modeling is the B.1.1.7 variant that was first detected in the UK (see Jan 11 update below). There is a high amount of uncertainty with our estimates that is not reflected in the chart. While we are showing our best estimate, is possible that true infections curve can be dramatically different (e.g. a fourth wave in March).. We are monitoring for more data regarding the other variants.
- We assume roughly 65 million people in the US (20% of the population) have already been infected by the time the first COVID-19 vaccine is authorized in mid-December 2020 (based on our latest covid19-projections.com model).
- At the start of the vaccine rollout in mid-December 2020, we assume ~99% of individuals who were previously infected still possess immunity. Over time, we assume a proportion of the infected population (~30%, increased from 10-20% on Feb 18) will lose their immunity by the end of 2021. The longer the time from infection, the higher the likelihood of immunity being lost. While it’s still unclear if prior infection confers long-term immunity, recent research (here and here) indicates that short-term reinfections are rare.
- We assume that the infection rate will fall as the number of individuals who are inoculated/vaccinated increases.
- We assume new infections will undergo a steady decrease from mid-December 2020 to March 2021. We account for the possibility of another wave of infections in late winter/early spring (March/April) as virus variants become more predominant and states relax restrictions from the fall wave. This final wave may not happen if a quick vaccine rollout can dampen the effects.
- To simplify the modeling, we count an individual as “immune via infection” the moment they are infected with the virus. In reality, it takes roughly 2-3 weeks after infection to develop antibodies.
- We use a basic SEIR model to estimate infections over time. This incorporates a reduction in the susceptible pool of individuals (and hence a lower infection rate) as the number of immune individuals increases.
- We factor in seasonality to a small extent.
- We assume a small number of imported cases per day. Due to a combination of imported cases and community spread, we believe daily infections in the US will likely not reach zero in 2021, even if herd immunity is reached.
Corollaries
- Our estimates show that roughly one third of the US population (~110 million) will have been infected by the SARS-CoV-2 virus by the end of 2021. That is an additional ~50 million infections since mid-December 2020.
- A one third prevalence estimate translates to a final US COVID-19 death toll of roughly 500,000 to 700,000 reported deaths by end of 2021, with 600,000 deaths being the best estimate. Given a mid-December 2020 death toll of 300,000, that is an additional ~300,000 deaths. While reported deaths are useful, excess deaths may be a better metric for the true death toll.
- Due to the high prevalence, a targeted approach for vaccination that prioritizes individuals who are more likely to be susceptible may improve the time to reach herd immunity.
- Due to possible low vaccine acceptance/uptake and waning immunity from natural infection, it is possible that the US will not reach immunity levels above 70%. In most scenarios, even 50-70% immunity could be sufficient to prevent large outbreaks.
- Due to the seasonality of the virus, the herd immunity threshold may be higher in the winter. Furthermore, herd immunity can be lost due to waning immunity. Therefore, it is important that we continue to vaccinate individuals even after herd immunity has been reached.
Helpful Data Sources
Below you will find a list of helpful vaccination data sources and dashboards. While we do not directly use them in our modeling, we highly recommend giving them a look.
Vaccine Rollout Tracker
Vaccine Development Tracker
Questions? Comments? Feedback?
You can reach Youyang Gu via the Contact page.
Past Updates
- February 21: There appears to be a methodology change for how the CDC reports vaccinations. Some clarifications via Bloomberg.
- February 5: We lowered our vaccine efficacy estimate from 90% to 85% to account for new variants and a lower efficacy of the Johnson & Johnson vaccine. Due to vaccine hesitancy and the later arrival of a children vaccine, it is possible that we do not reach the levels required for herd immunity in 2021. Nevertheless, herd immunity does not have a hard threshold, and being close to herd immunity may be sufficient to prevent large outbreaks. We are actively working to incorporate the new variants into our modeling.
- January 28: We are releasing raw and adjusted CDC vaccination time series data for download on GitHub. It contains every CDC vaccination update since they started releasing data on Dec 20, 2020. They will be updated daily. In addition, we separated our Path to Herd Immunity plot into three categories: immunity from vaccination only, immunity from vaccination & past infection, and immunity from past infection only. Previously, we assigned immunity to the one that was acquired first (either prior infection or vaccination).
- January 26: We are factoring in rollout of the single-dose Johnson & Johnson vaccine starting in late February/early March. In the past week, over 1 million doses were administered per day. Given no unforeseen supply issue from Pfizer/Moderna, we now estimate that the general public can receive the vaccine by April, and over 60% of the US adult population will be fully vaccinated by June. We also estimate that over 200 million doses will be administered in the first 100 days of the new presidential administration, more than double the administratoin’s original “100 million shots in 100 days” goal. Our timeline for a “return to normal” remains unchanged (June-August 2021).
- January 14: We separated CDC data for vaccine doses into 1st and 2nd doses. As complete data is not available, we applied interpolation and heuristics to fill in any missing data.
- January 12: We added vaccination plots to the infections page for every US state (and nationally) based on the latest CDC data. For example, see the vaccination progress for California. To find another state, click here. See maps of the vaccination progress for all 50 states here.
- January 11: In response to the new COVID-19 B.1.1.7 variant (preliminary study here), we increased our herd immunity threshold from 60%+ to 70%+. We have also increased our total infections estimates (30% -> 35-40%) and deaths estimates (500k -> 600k ±100k) in response to this new strain and a slower-than-expected vaccination rollout. We are in the process of gathering more data to better incorporate this variant into our modeling (e.g. Jan 15 CDC modeling).
- January 5: We added a plot of daily US vaccinations based on CDC data.
- December 24: We added a plot of the most up-to-date information on doses distributed and people vaccinated, based on CDC data. To track global vaccination progress, see the Bloomberg Vaccine Tracker.