Historical Performance
Last Updated: November 2, 2020 (See our GitHub repo for the most update-to-date evaluations)
On this page, we present a weekly evaluation of our model’s historical performance along with other models in the COVID-19 Forecast Hub. The forecasts from these models are sent to the CDC weekly and presented on the CDC COVID-19 Forecasting page.
We have open-sourced the code and output used to generate these evaluations here. We believe in a fully transparent evaluation methodology, and publicly releasing all of our code and data is the best way to do so.
Click here to see some sample plots of our past projections.
The charts below represent past state-by-state and US projections evaluated on cumulative deaths on the specified evaluation date (June 20, June 13, etc). As the charts may be outdated, please consult our evaluation page for the latest data.
- 4 Week Ahead
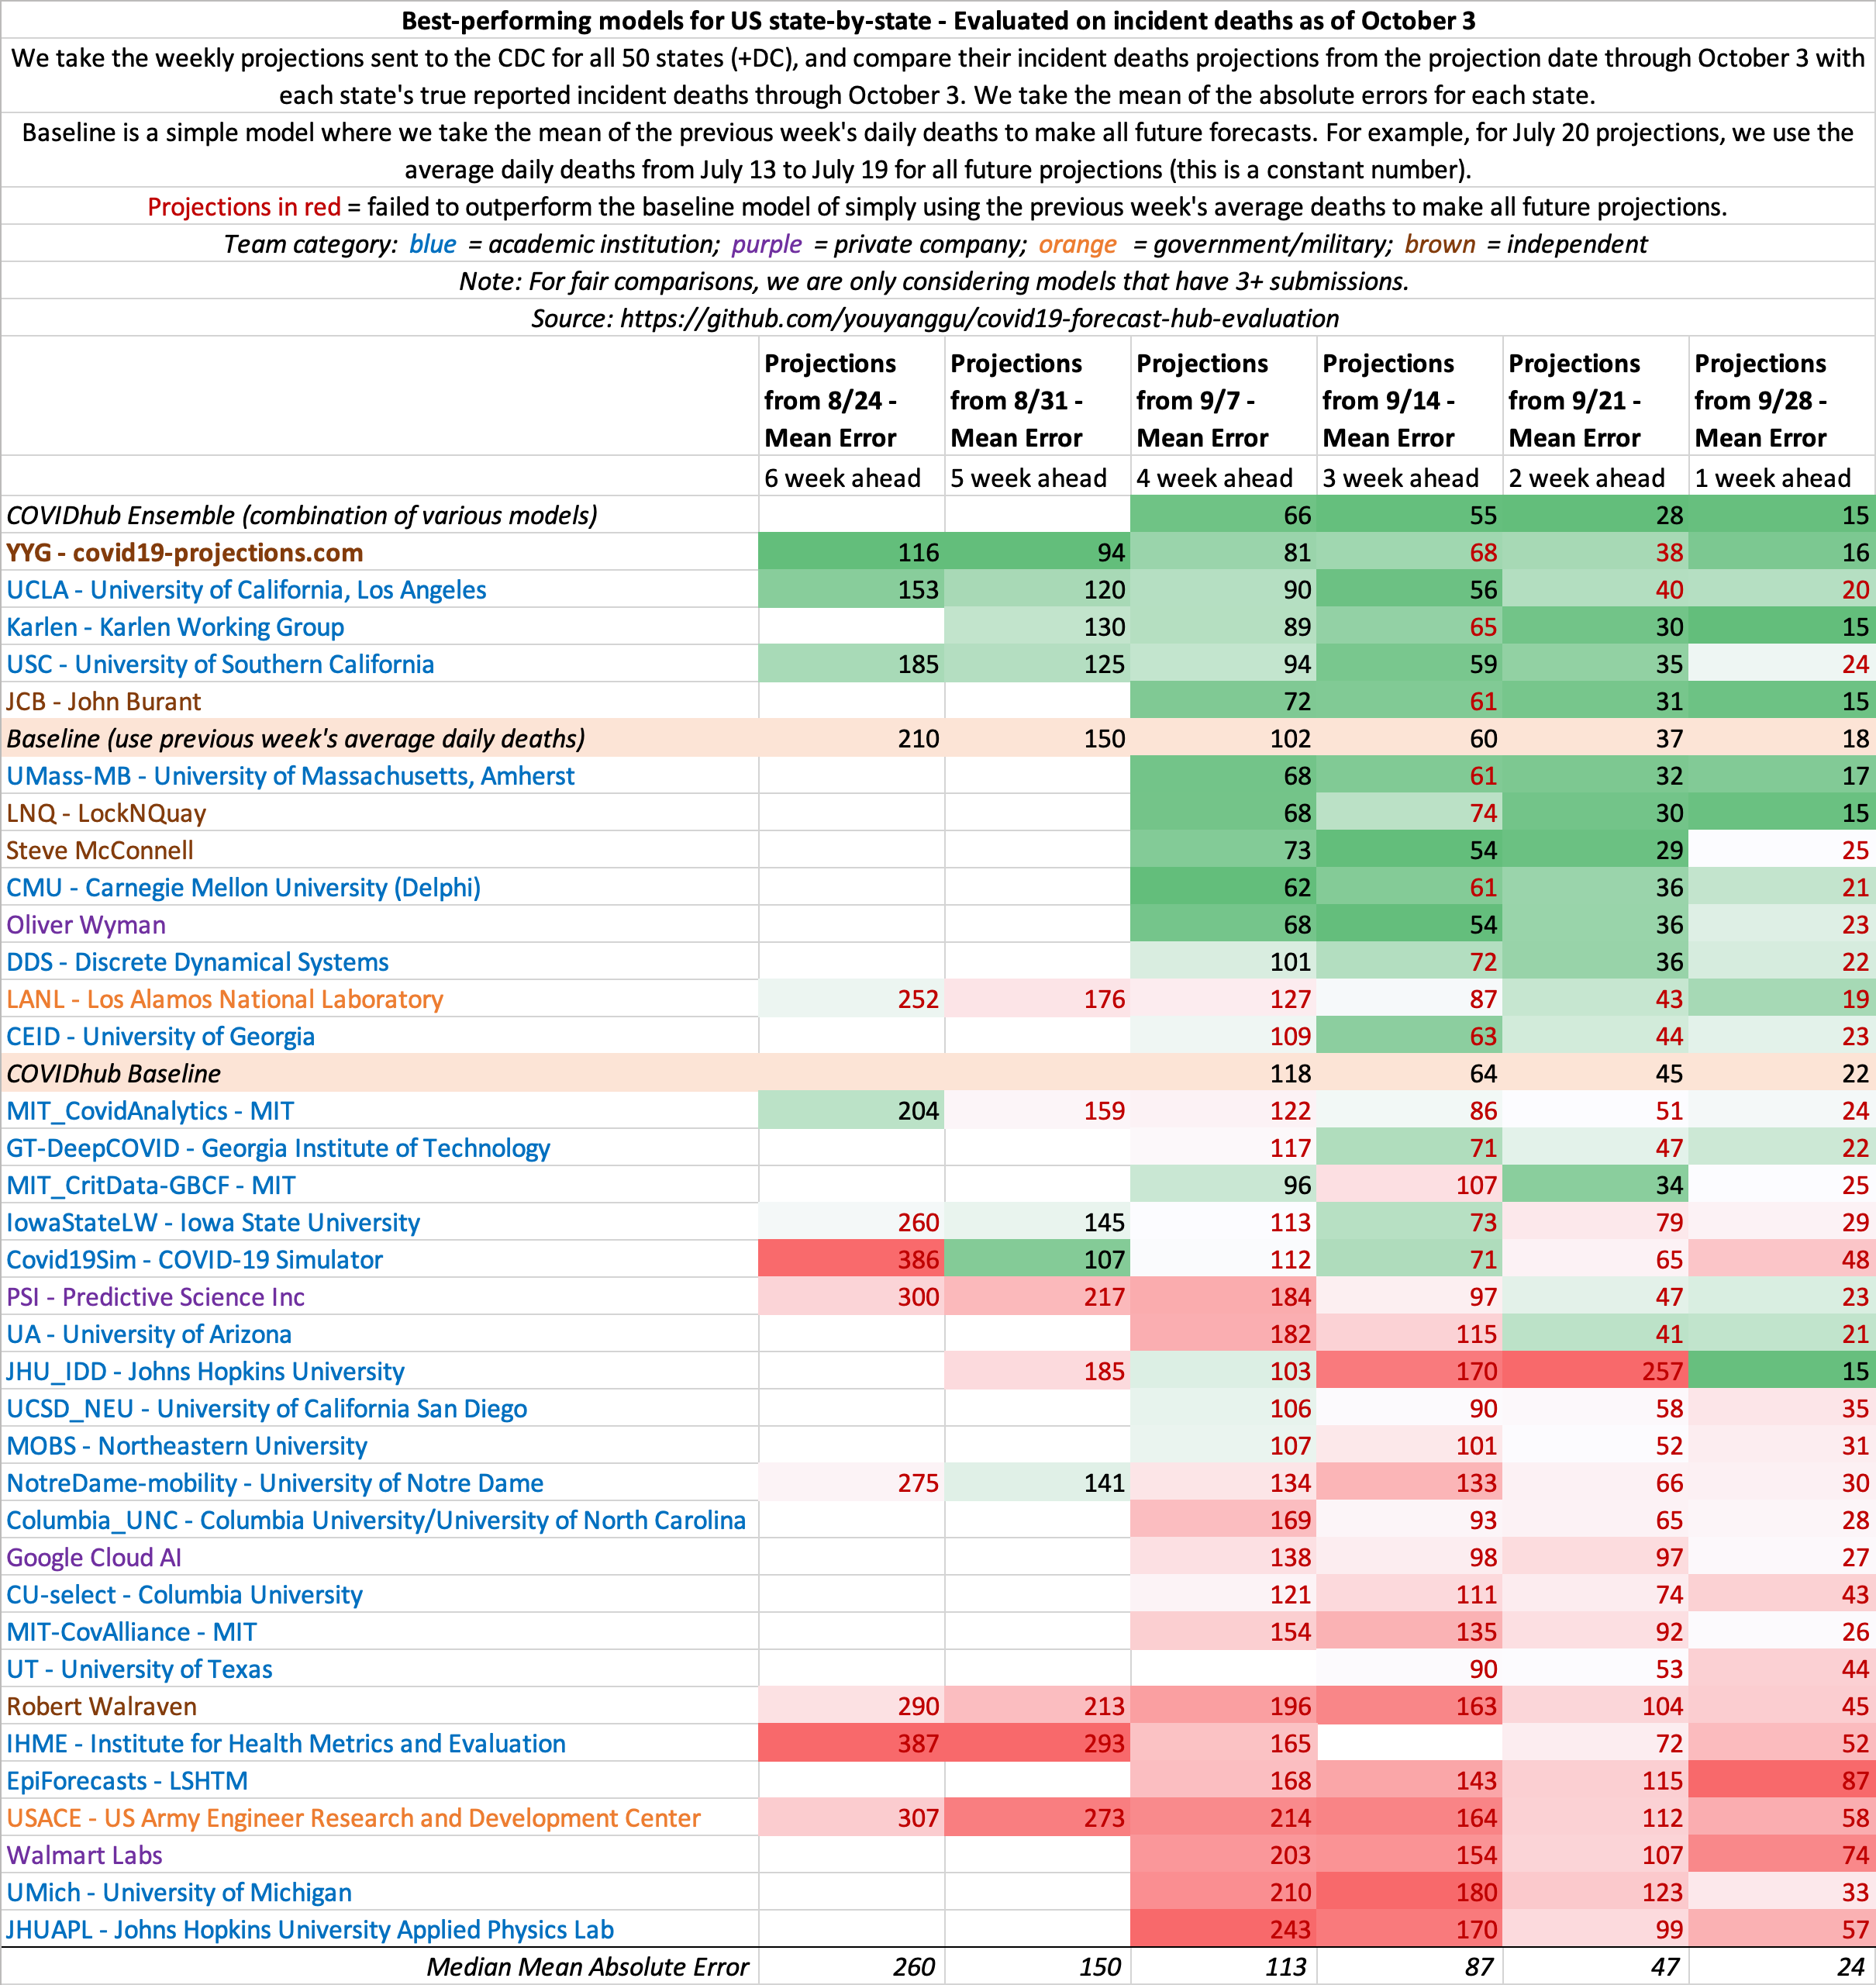
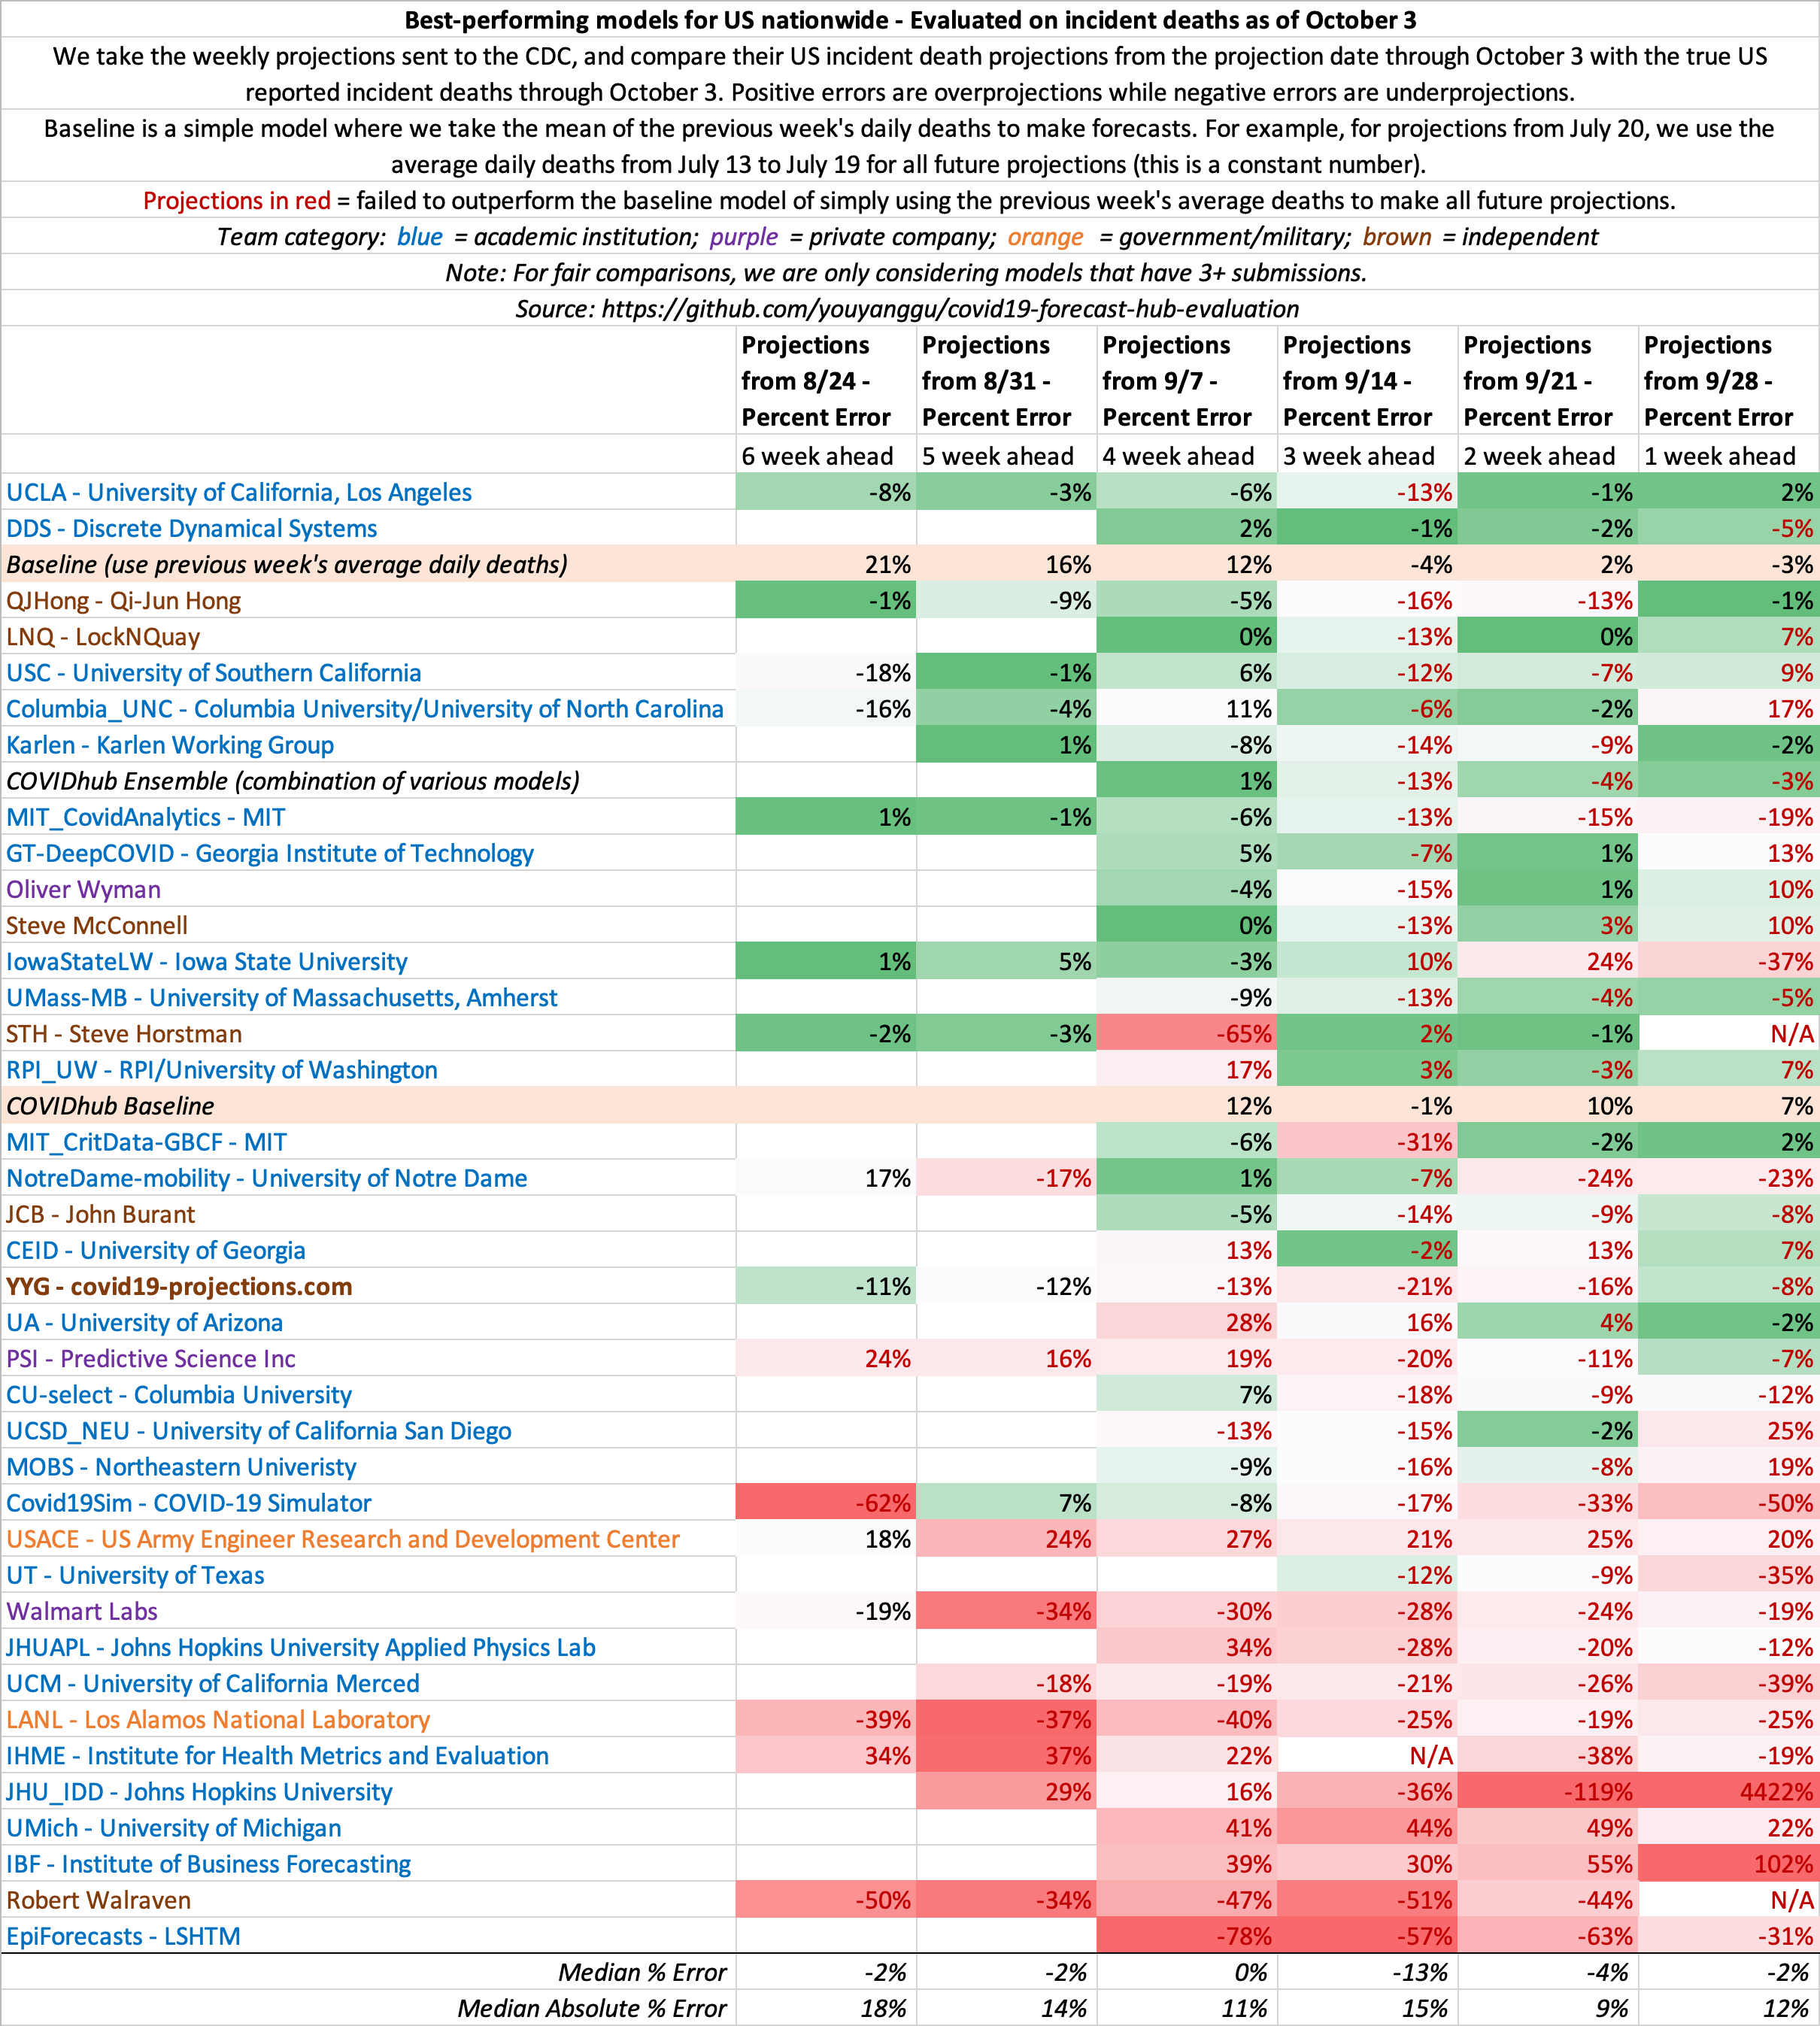
- October 3
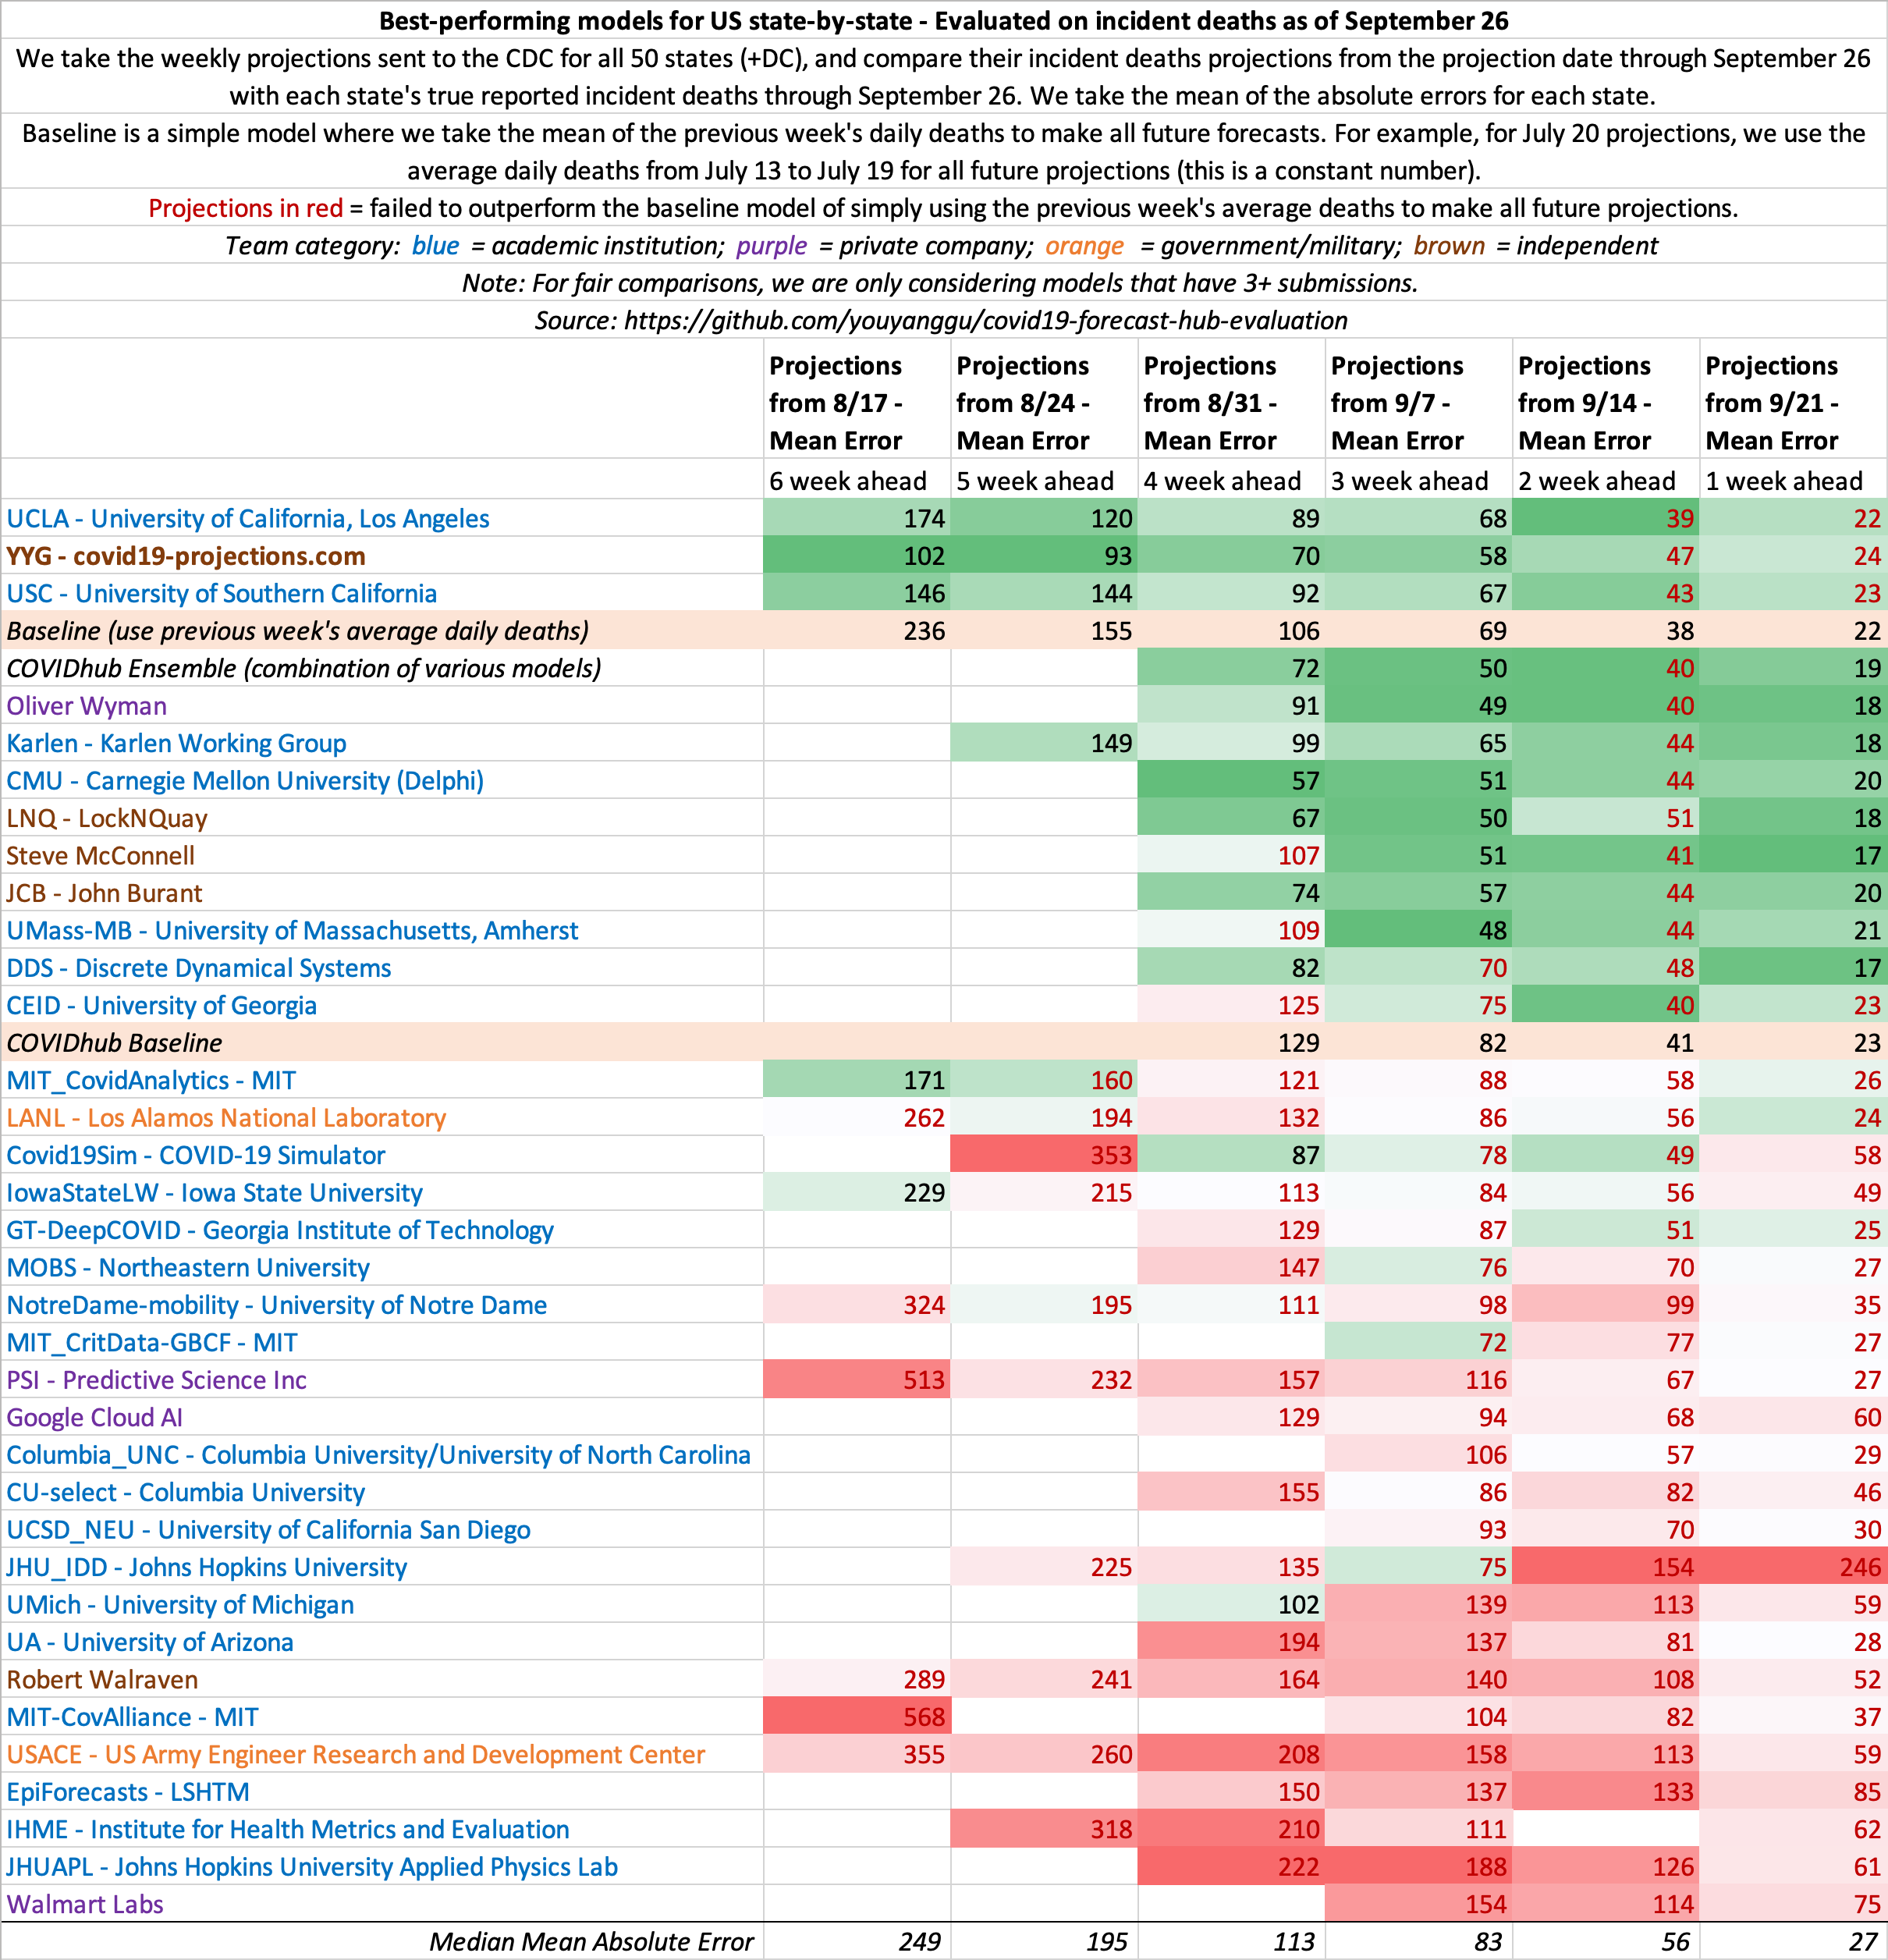
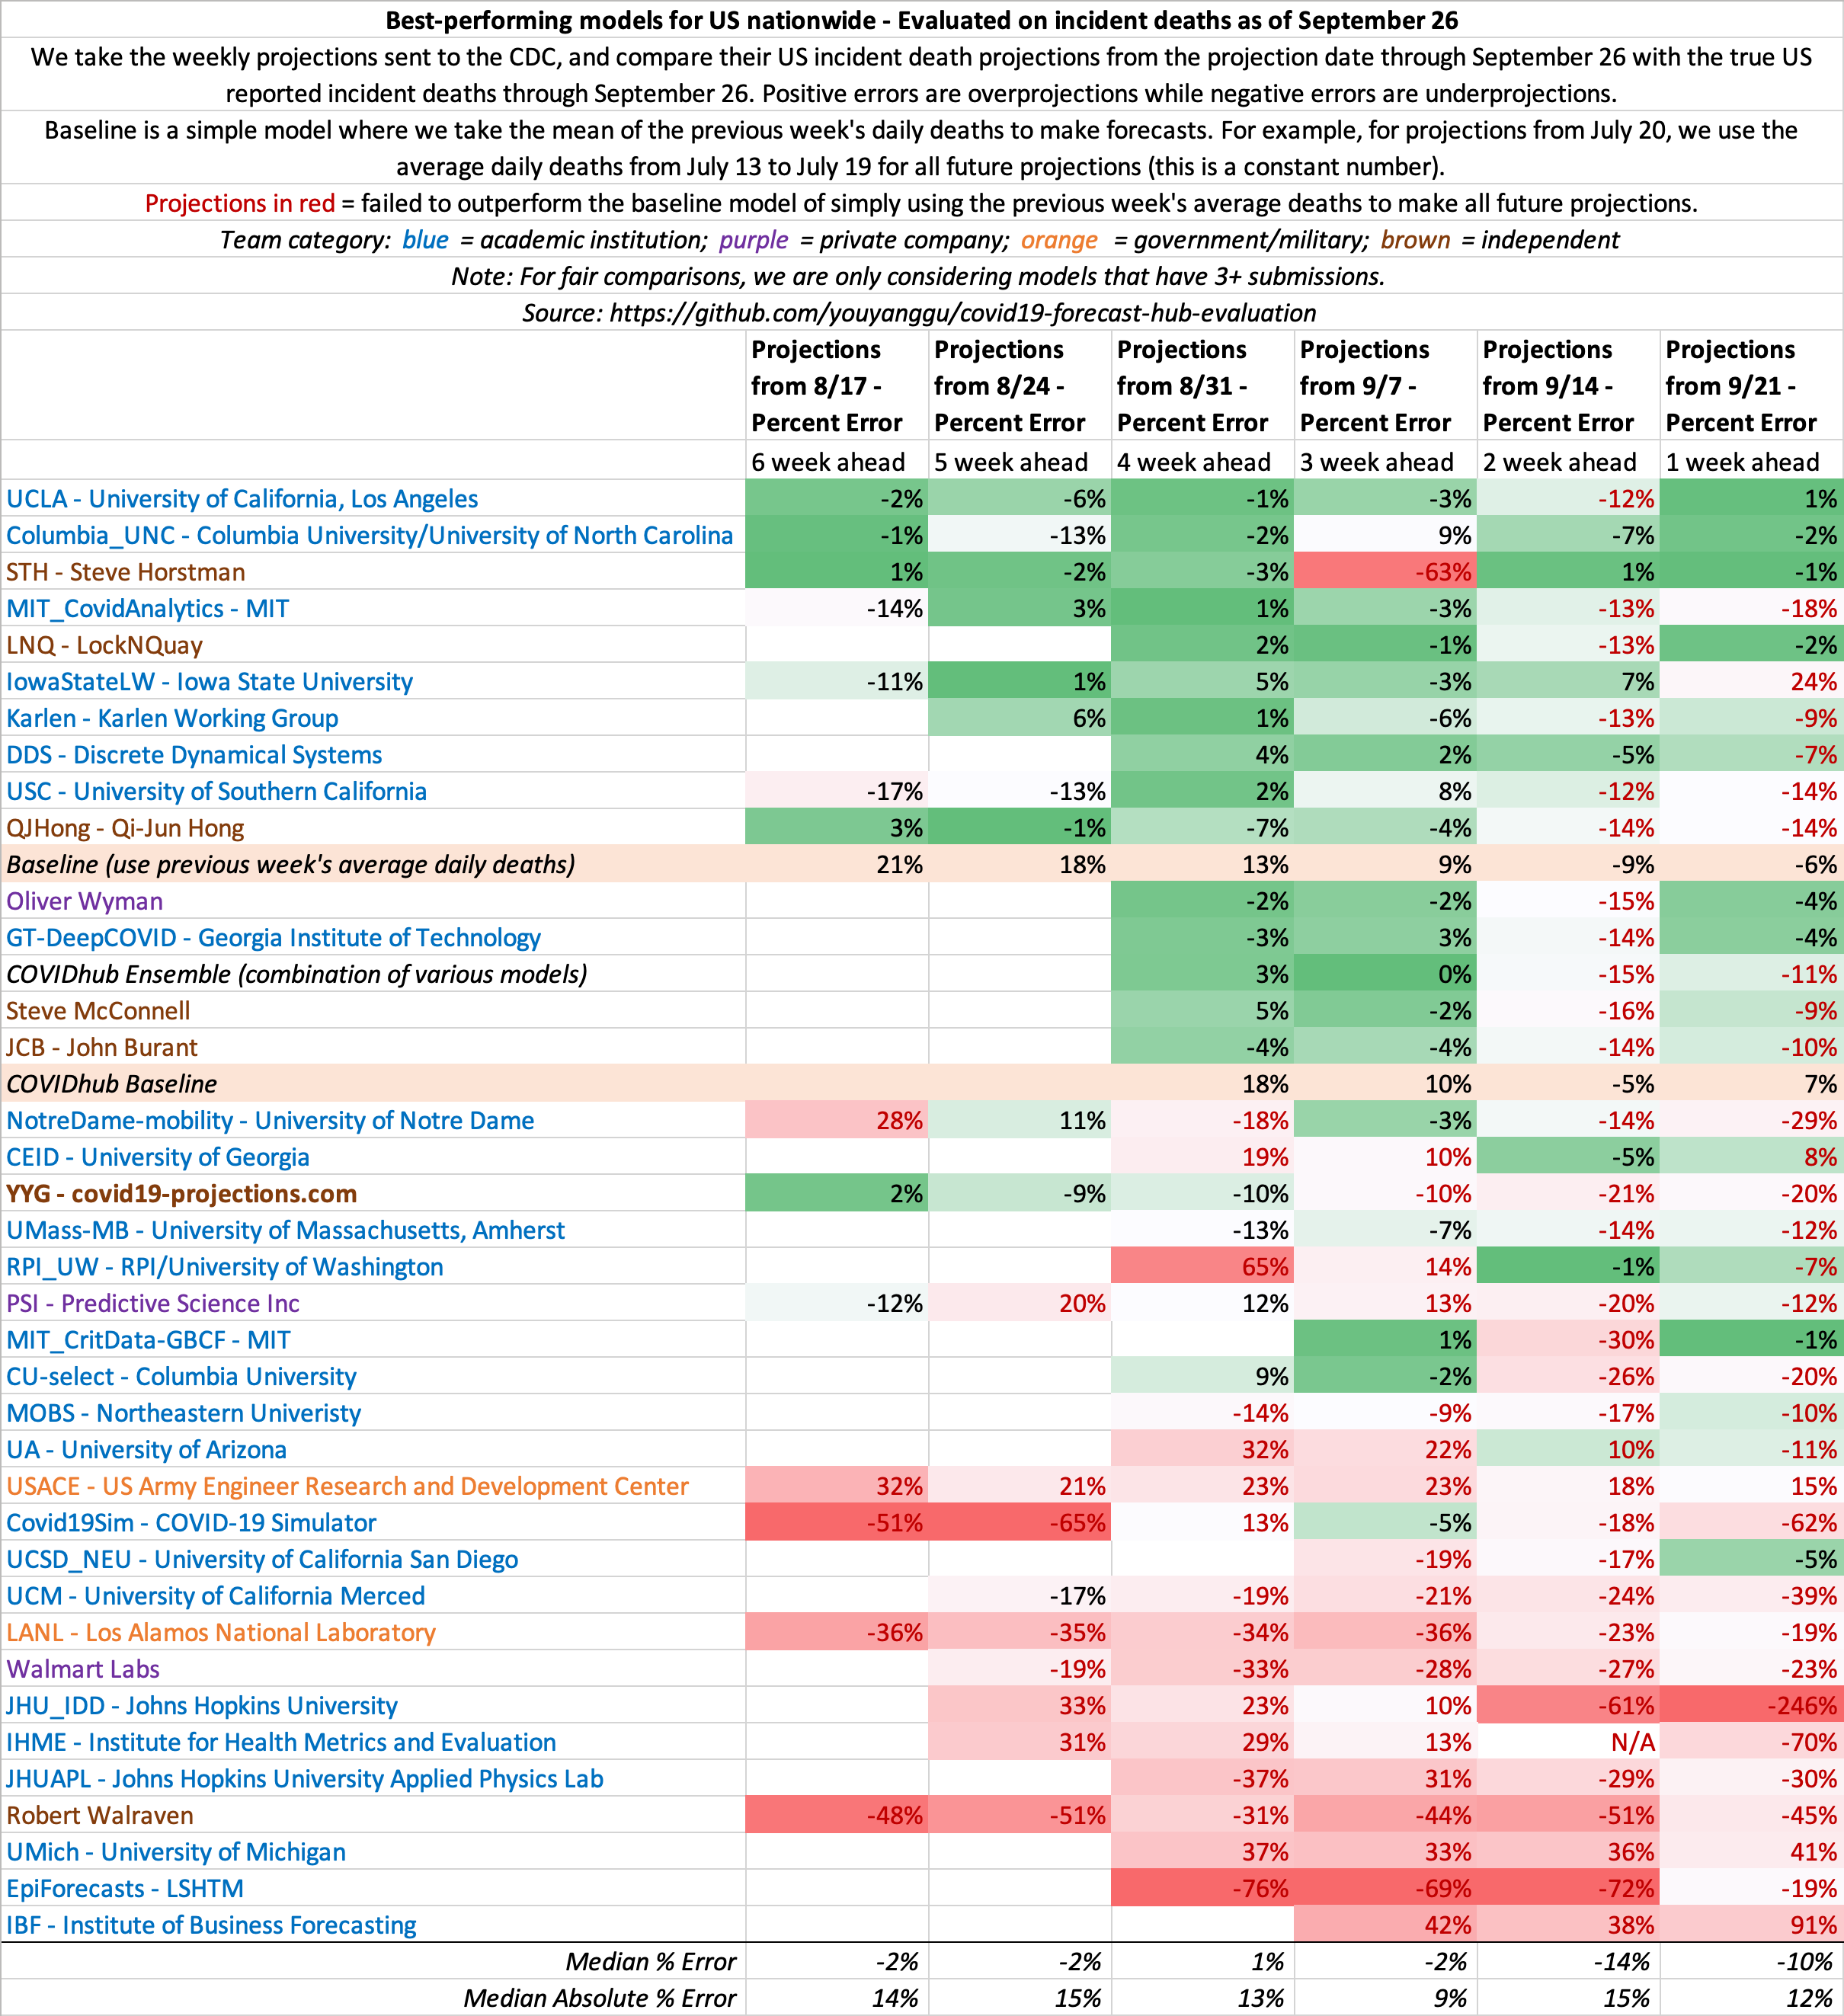
- September 26
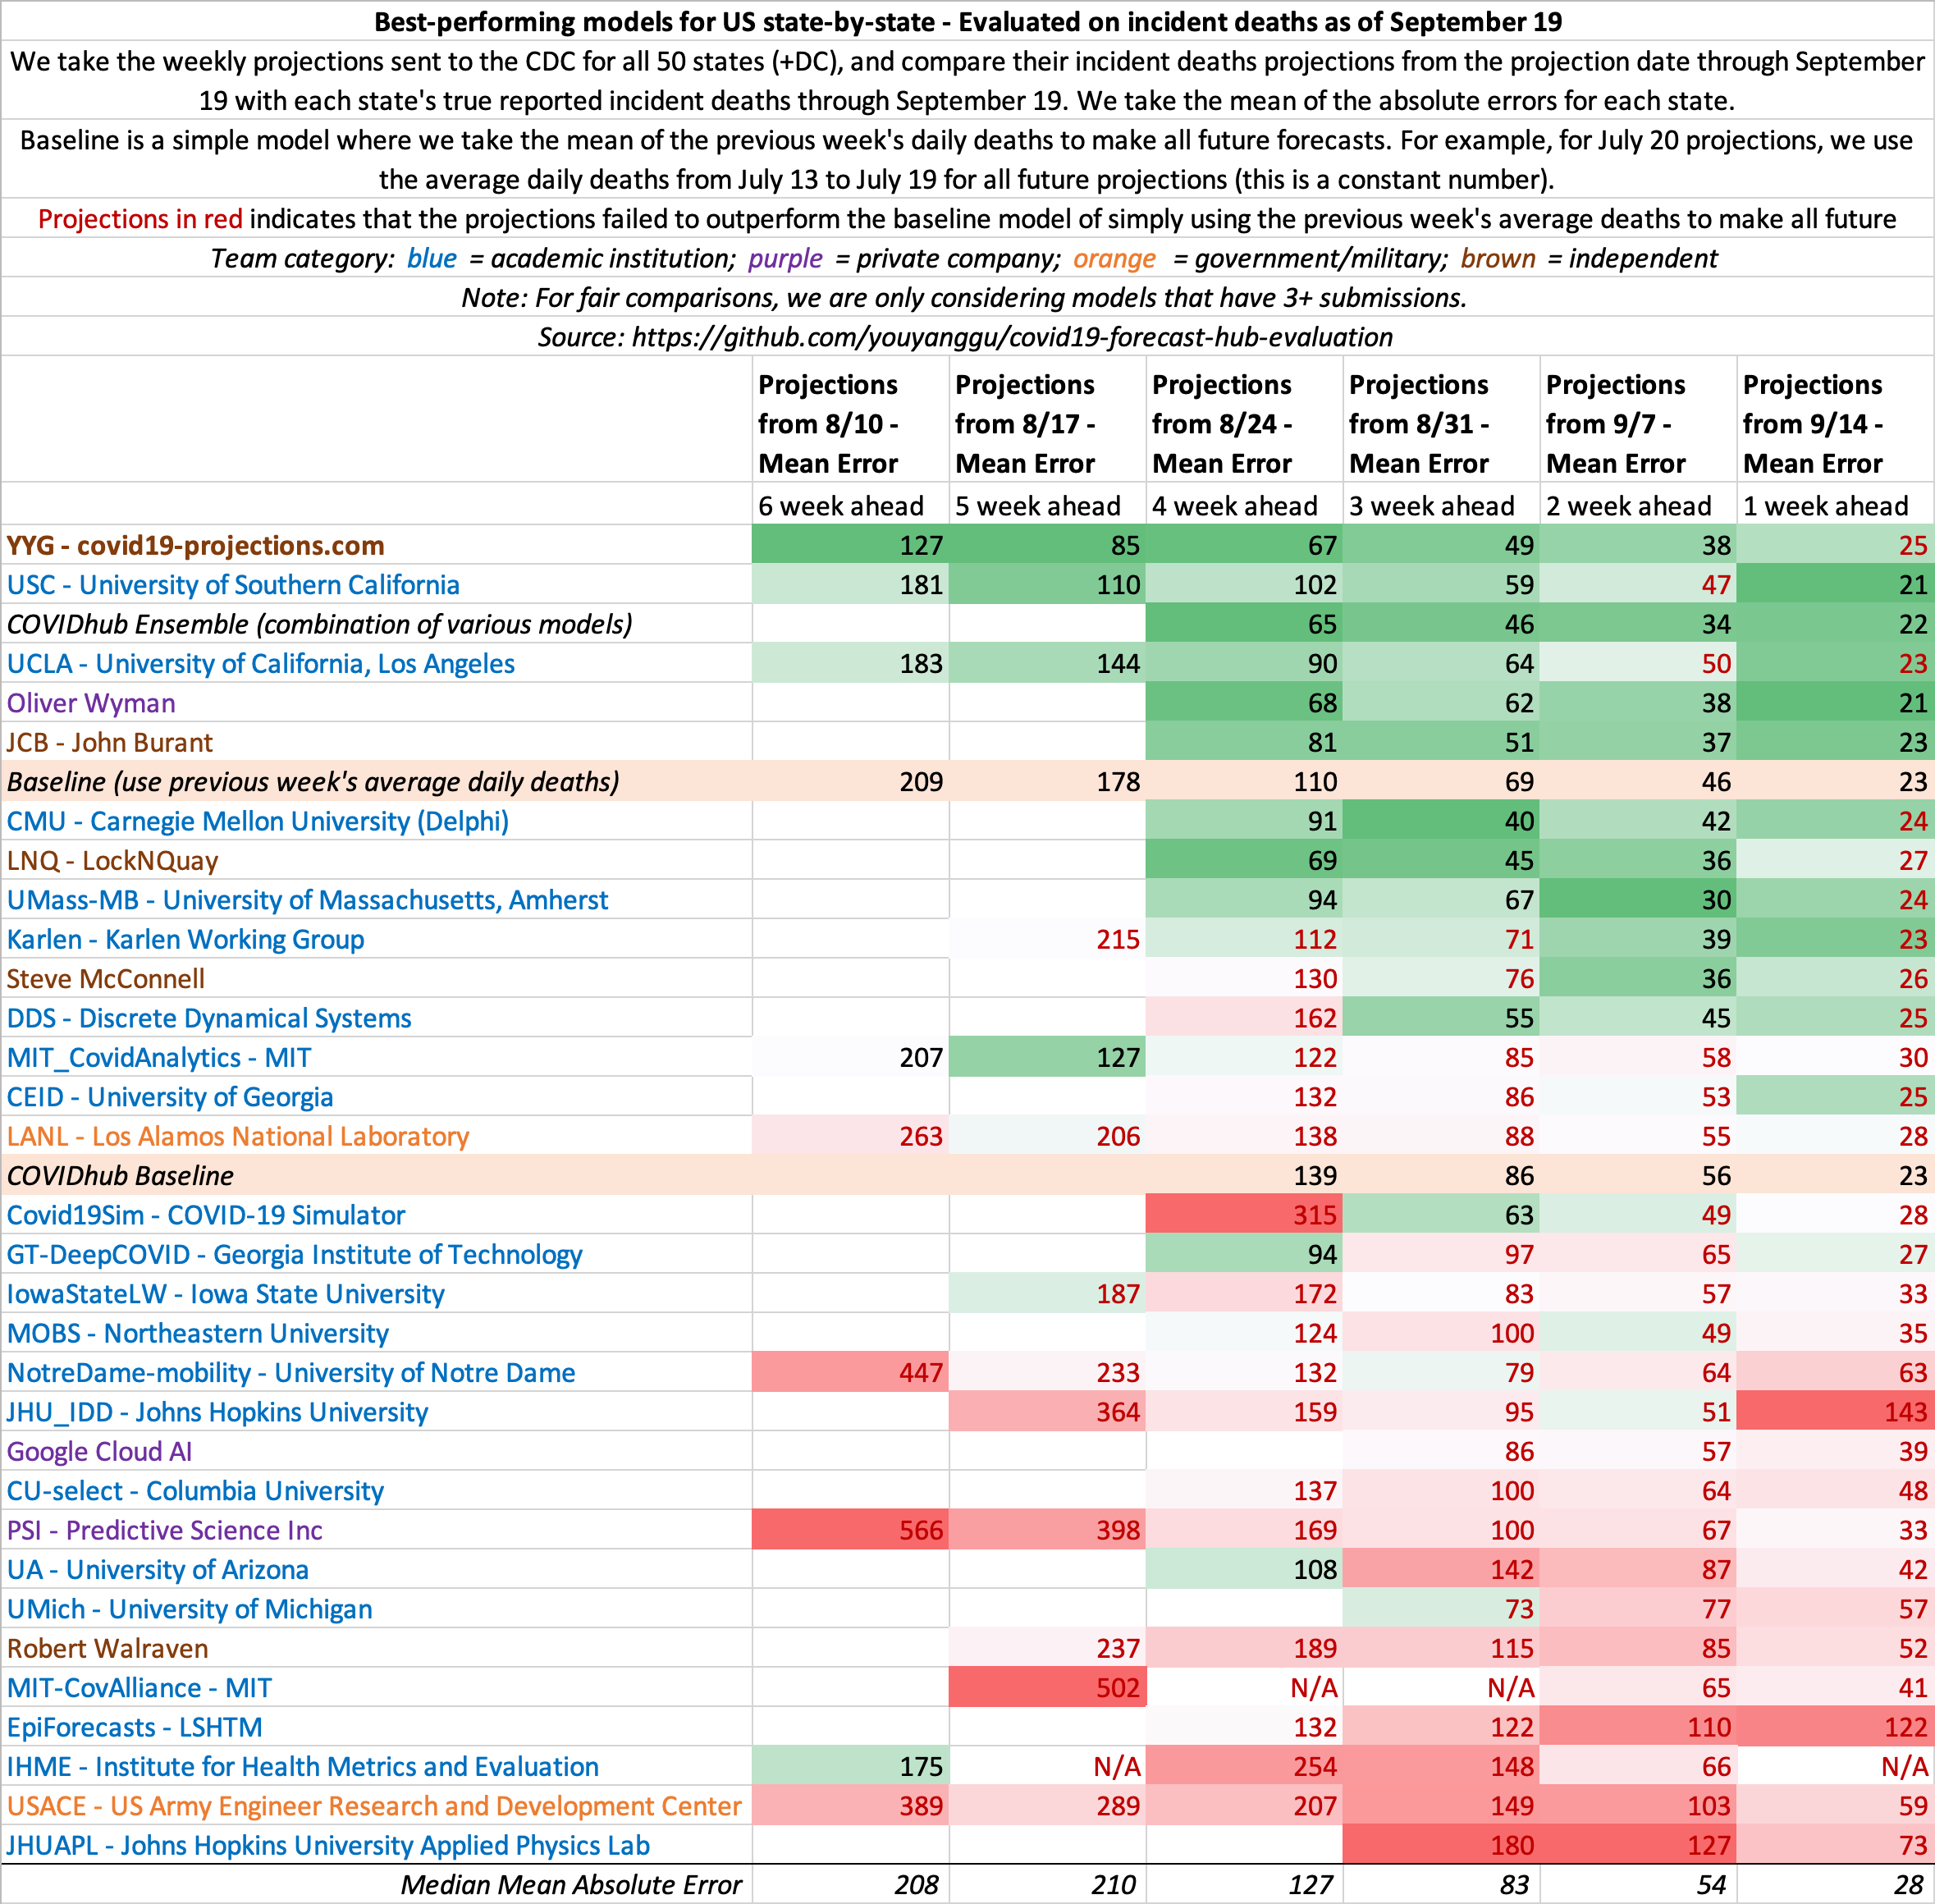
- September 19
- September 12
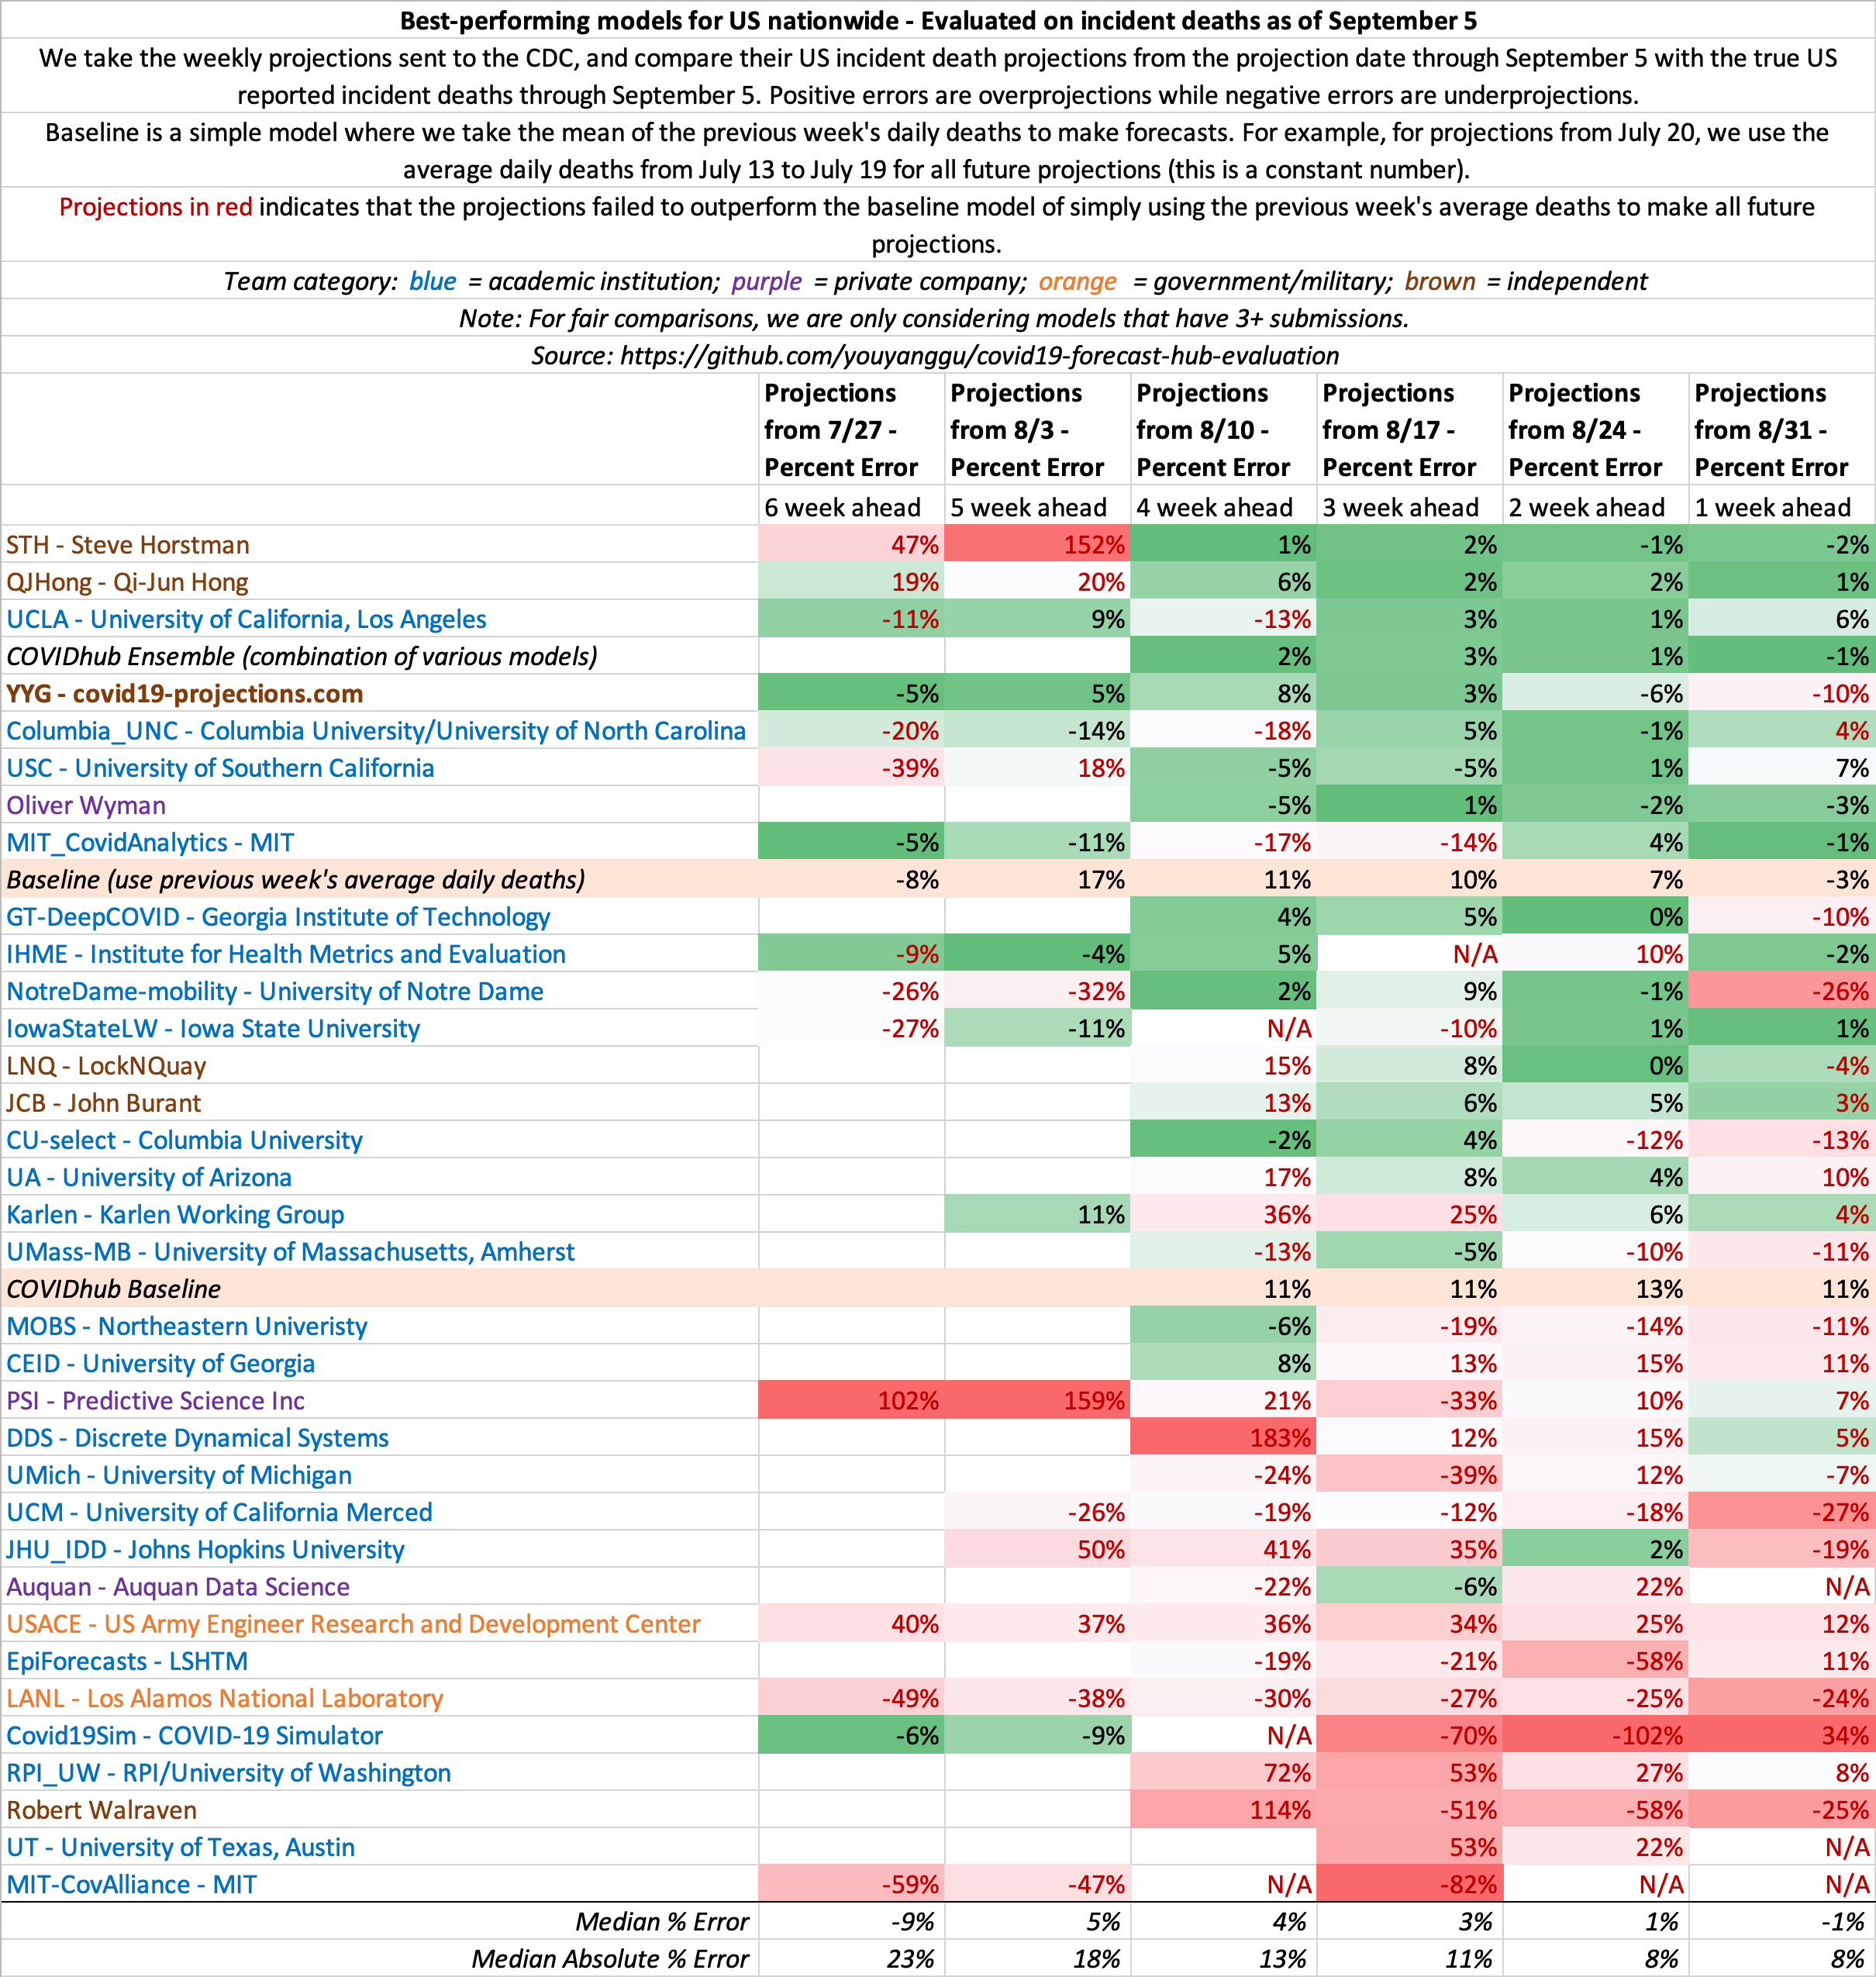
- September 5
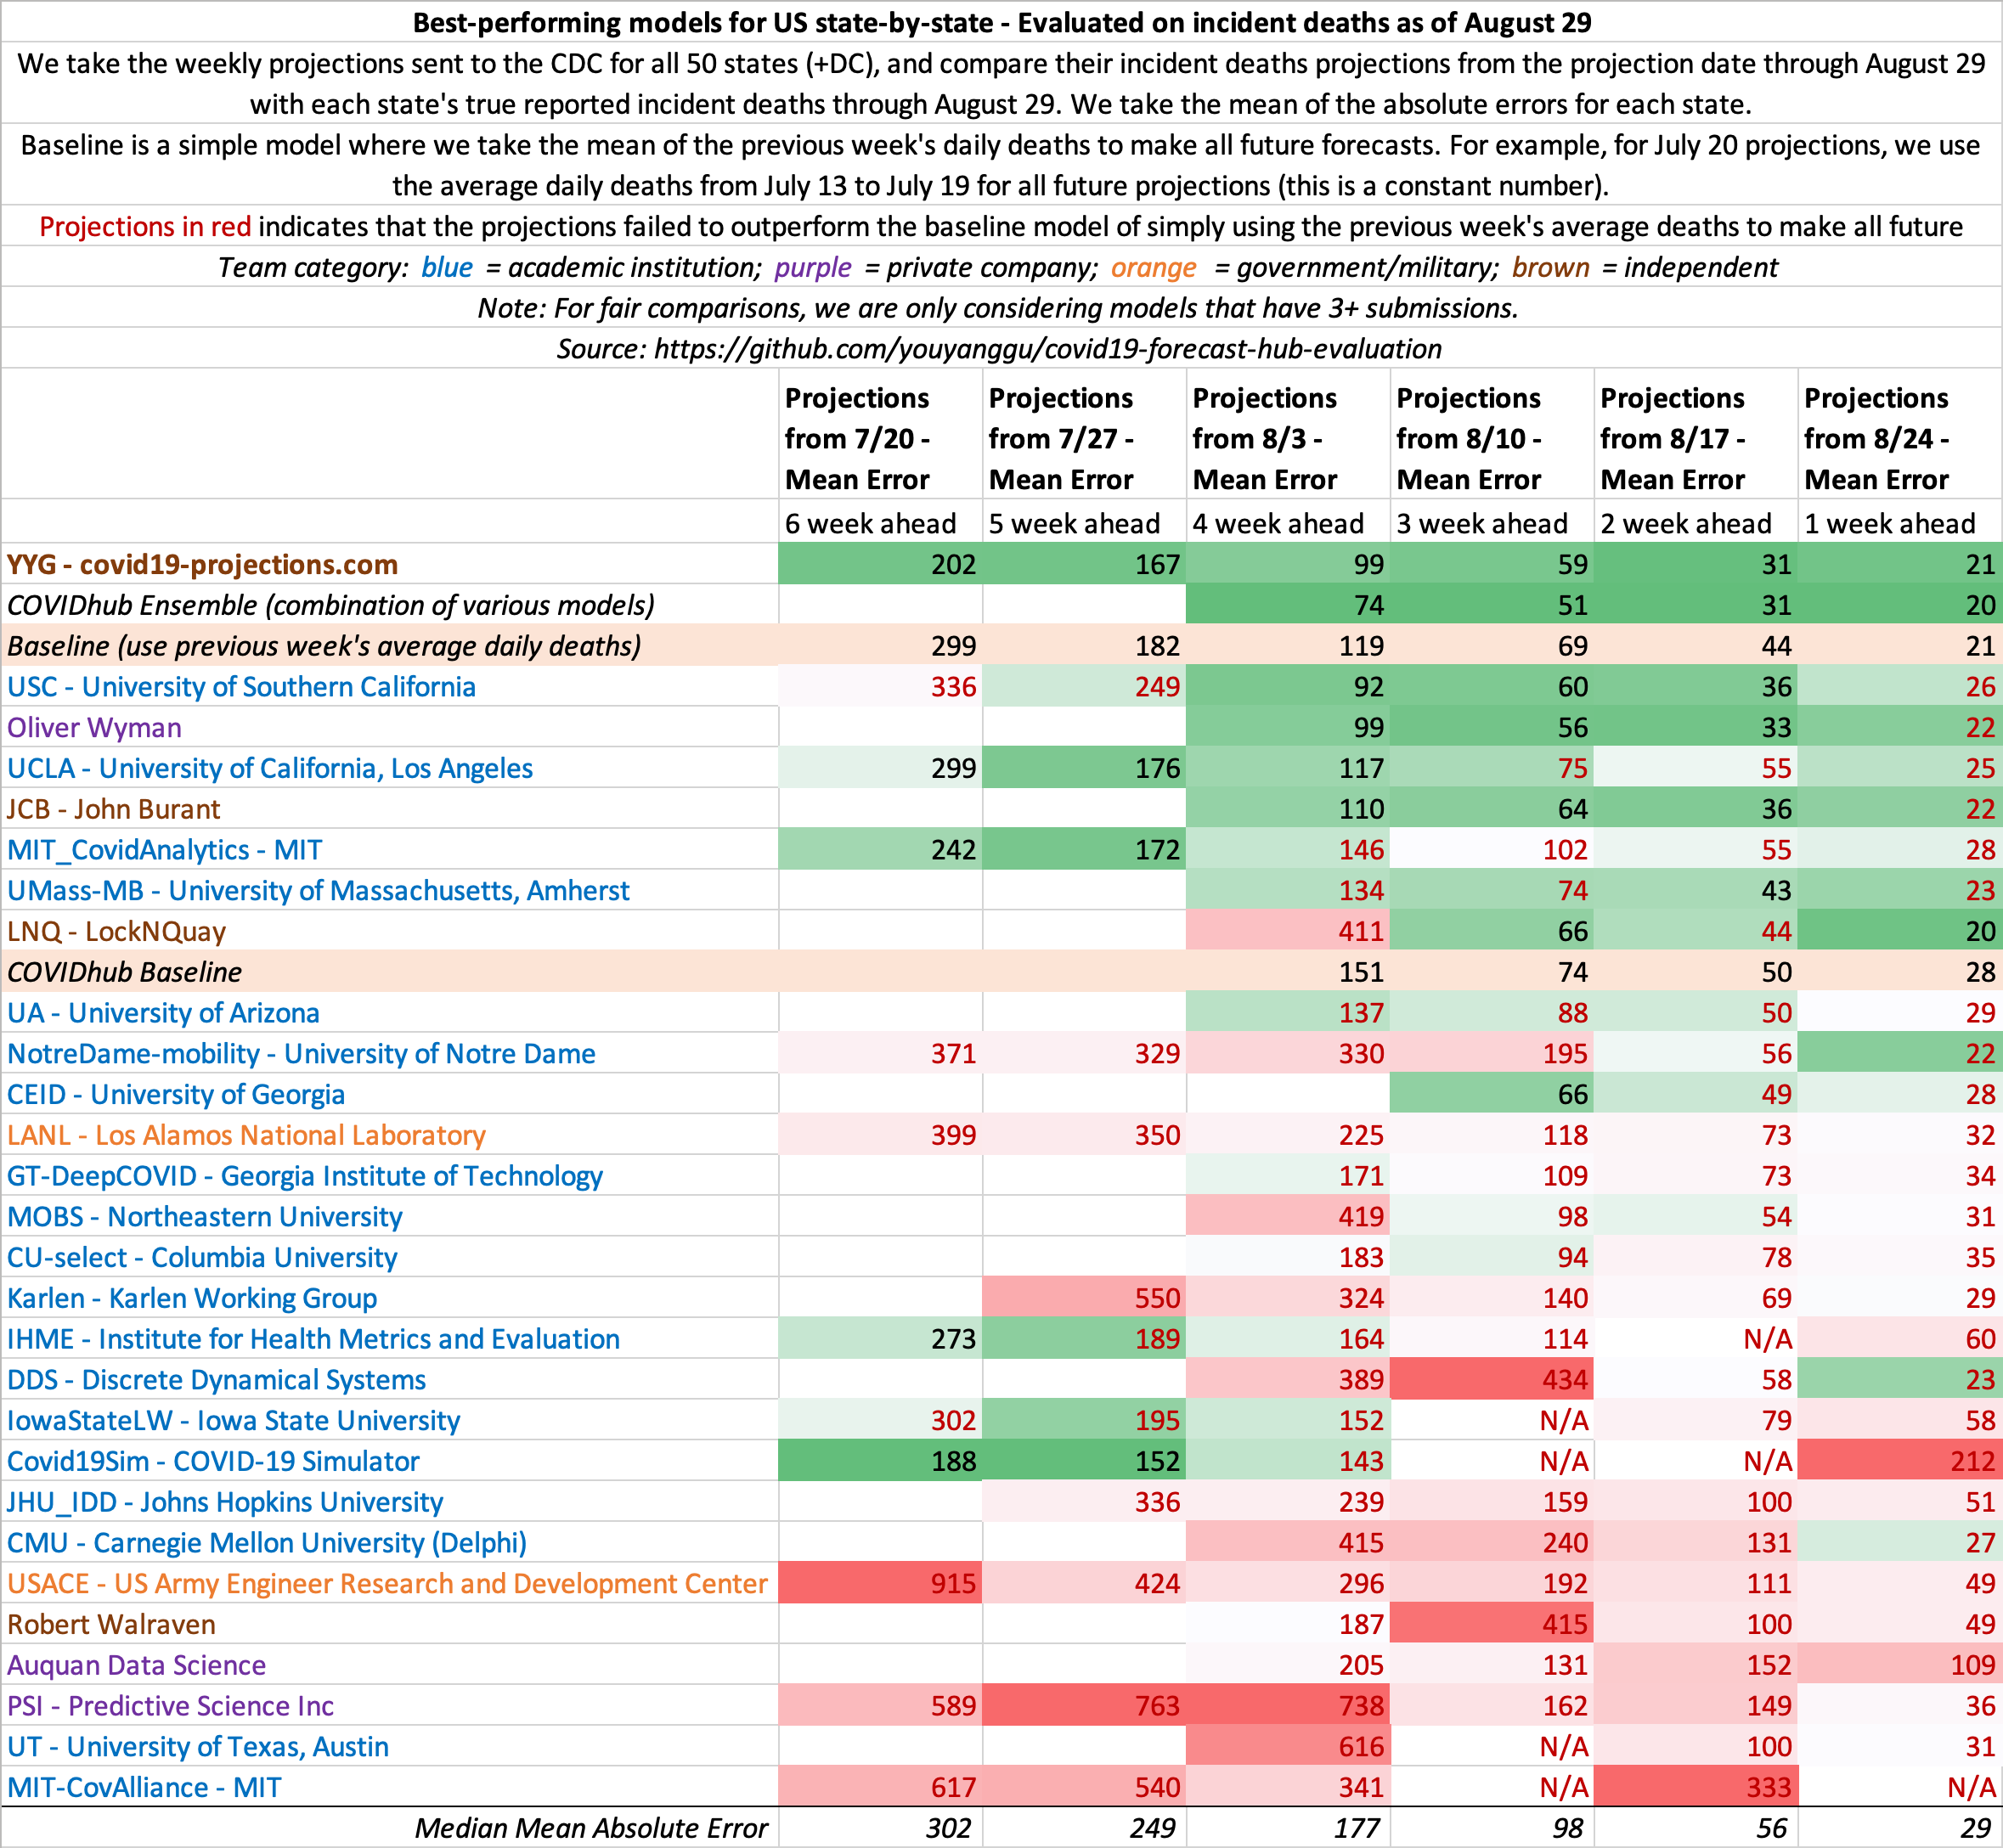
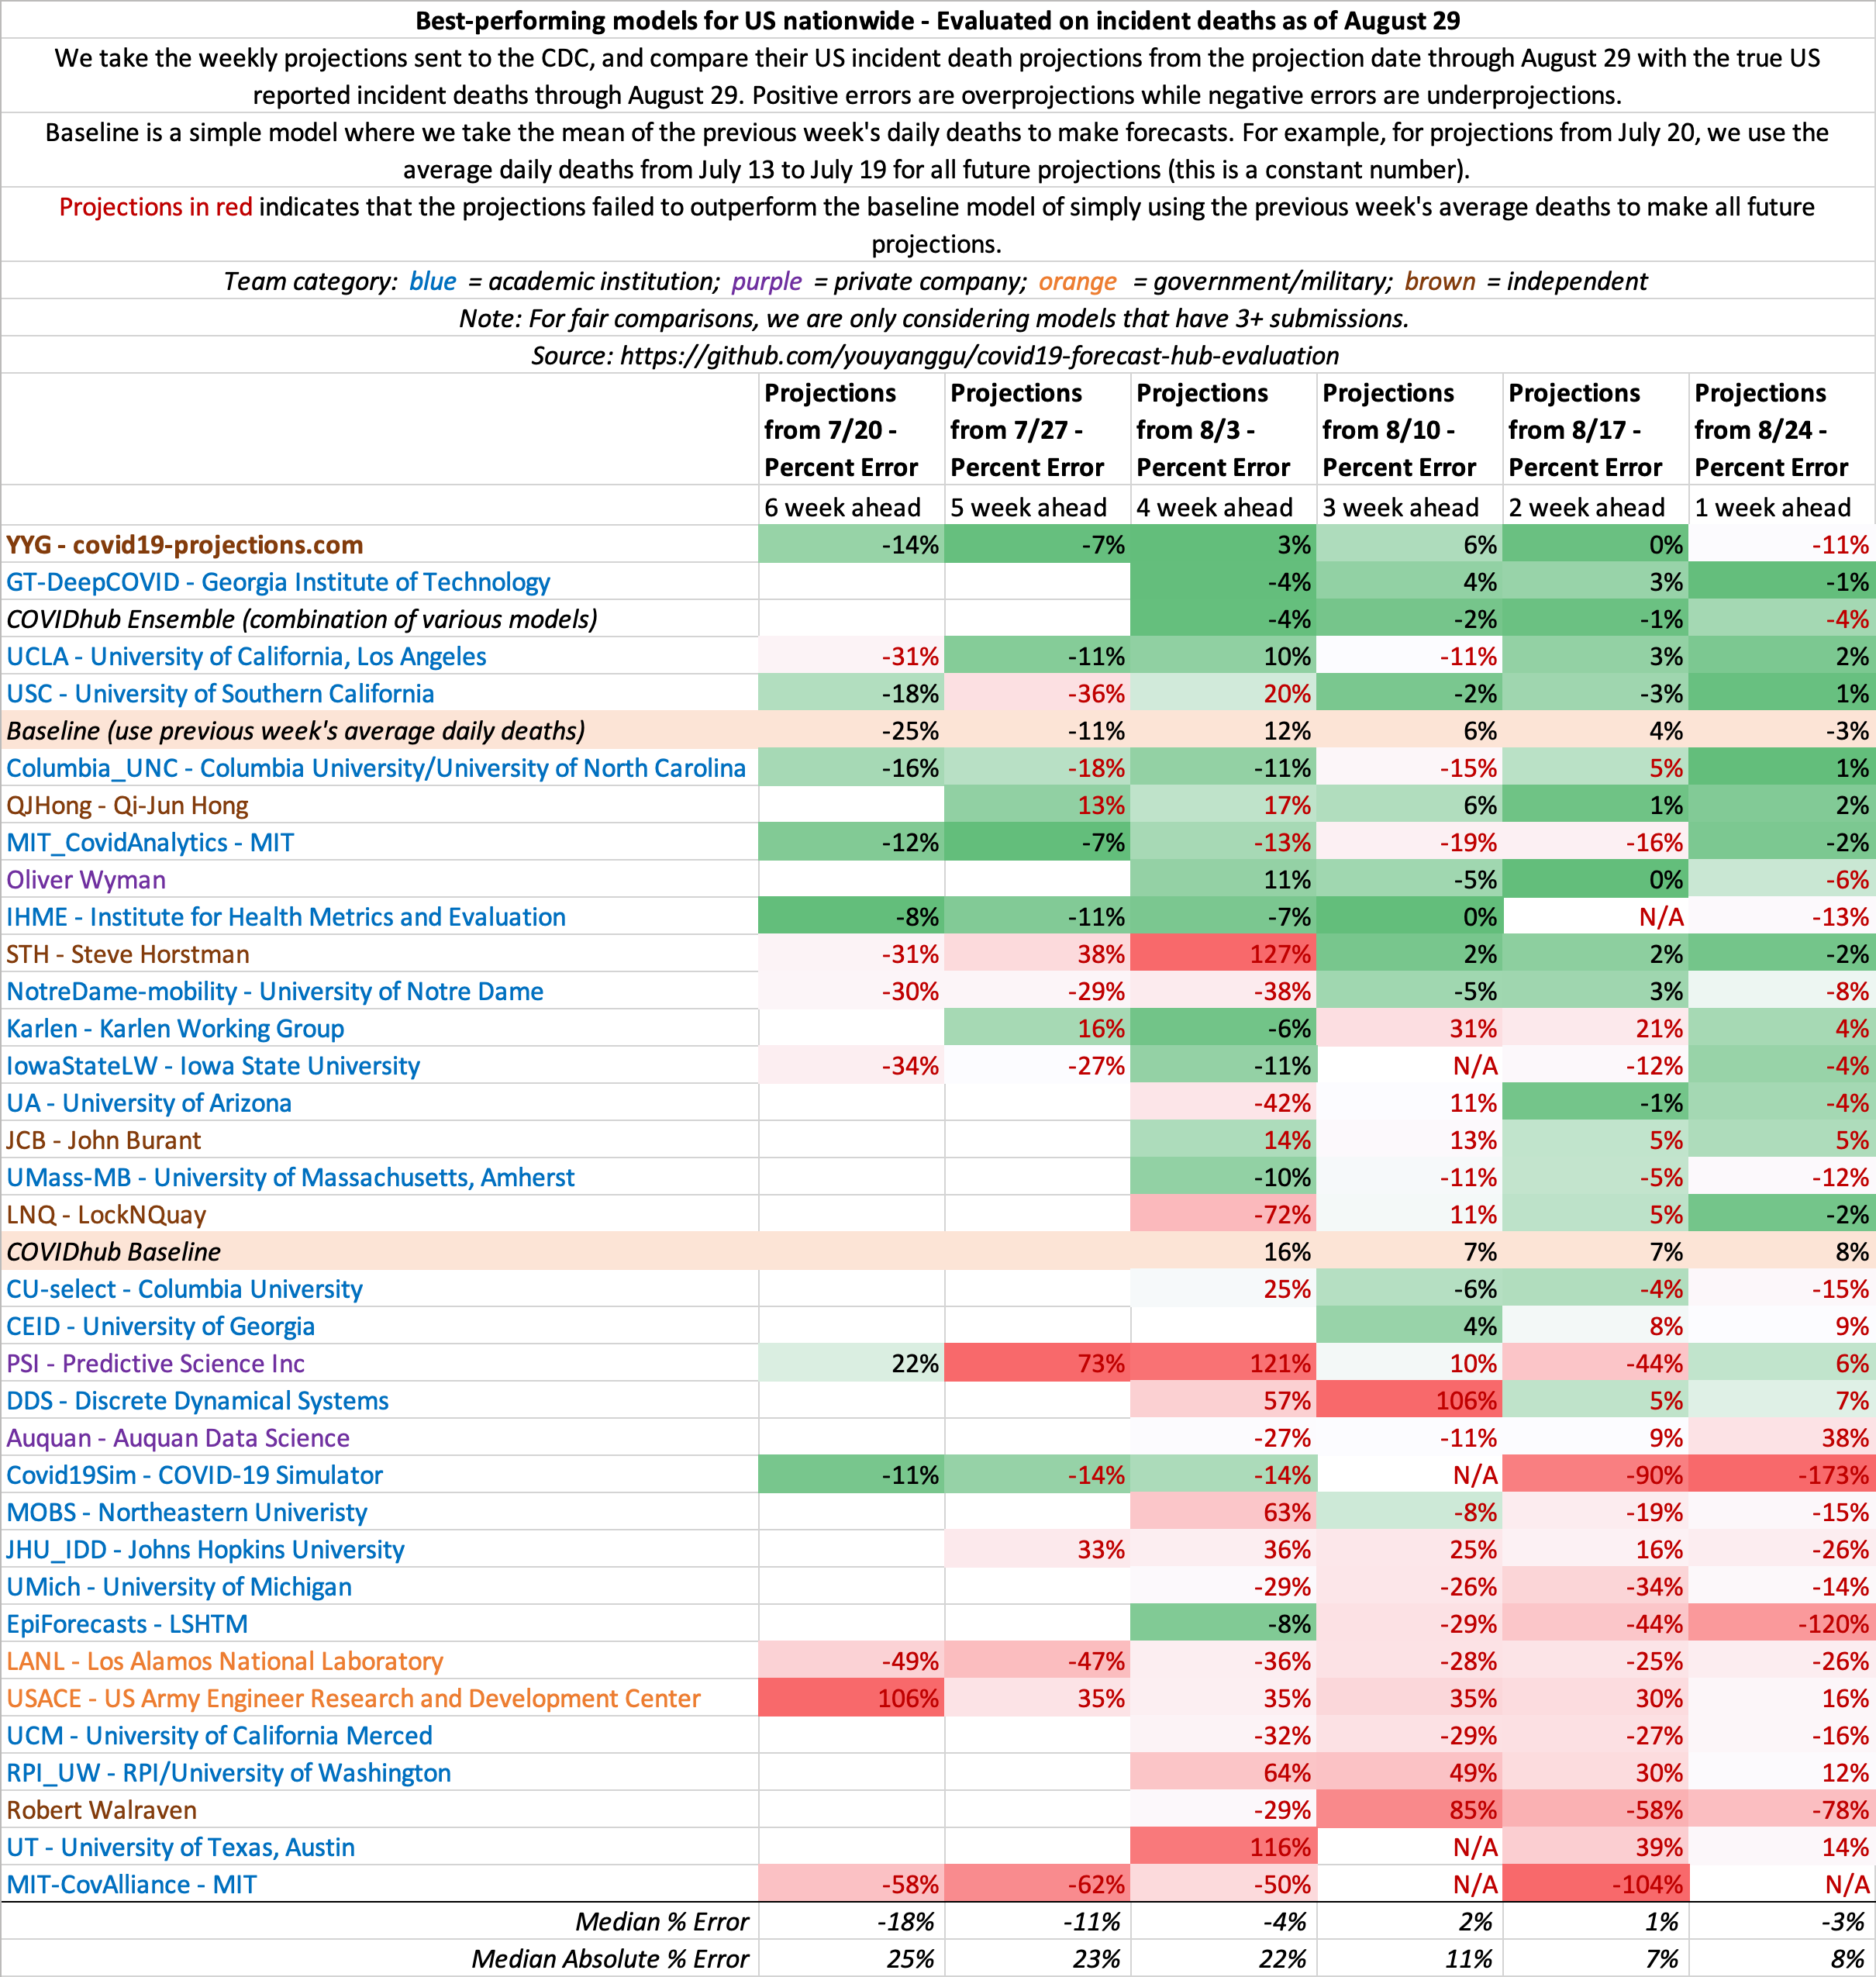
- August 29
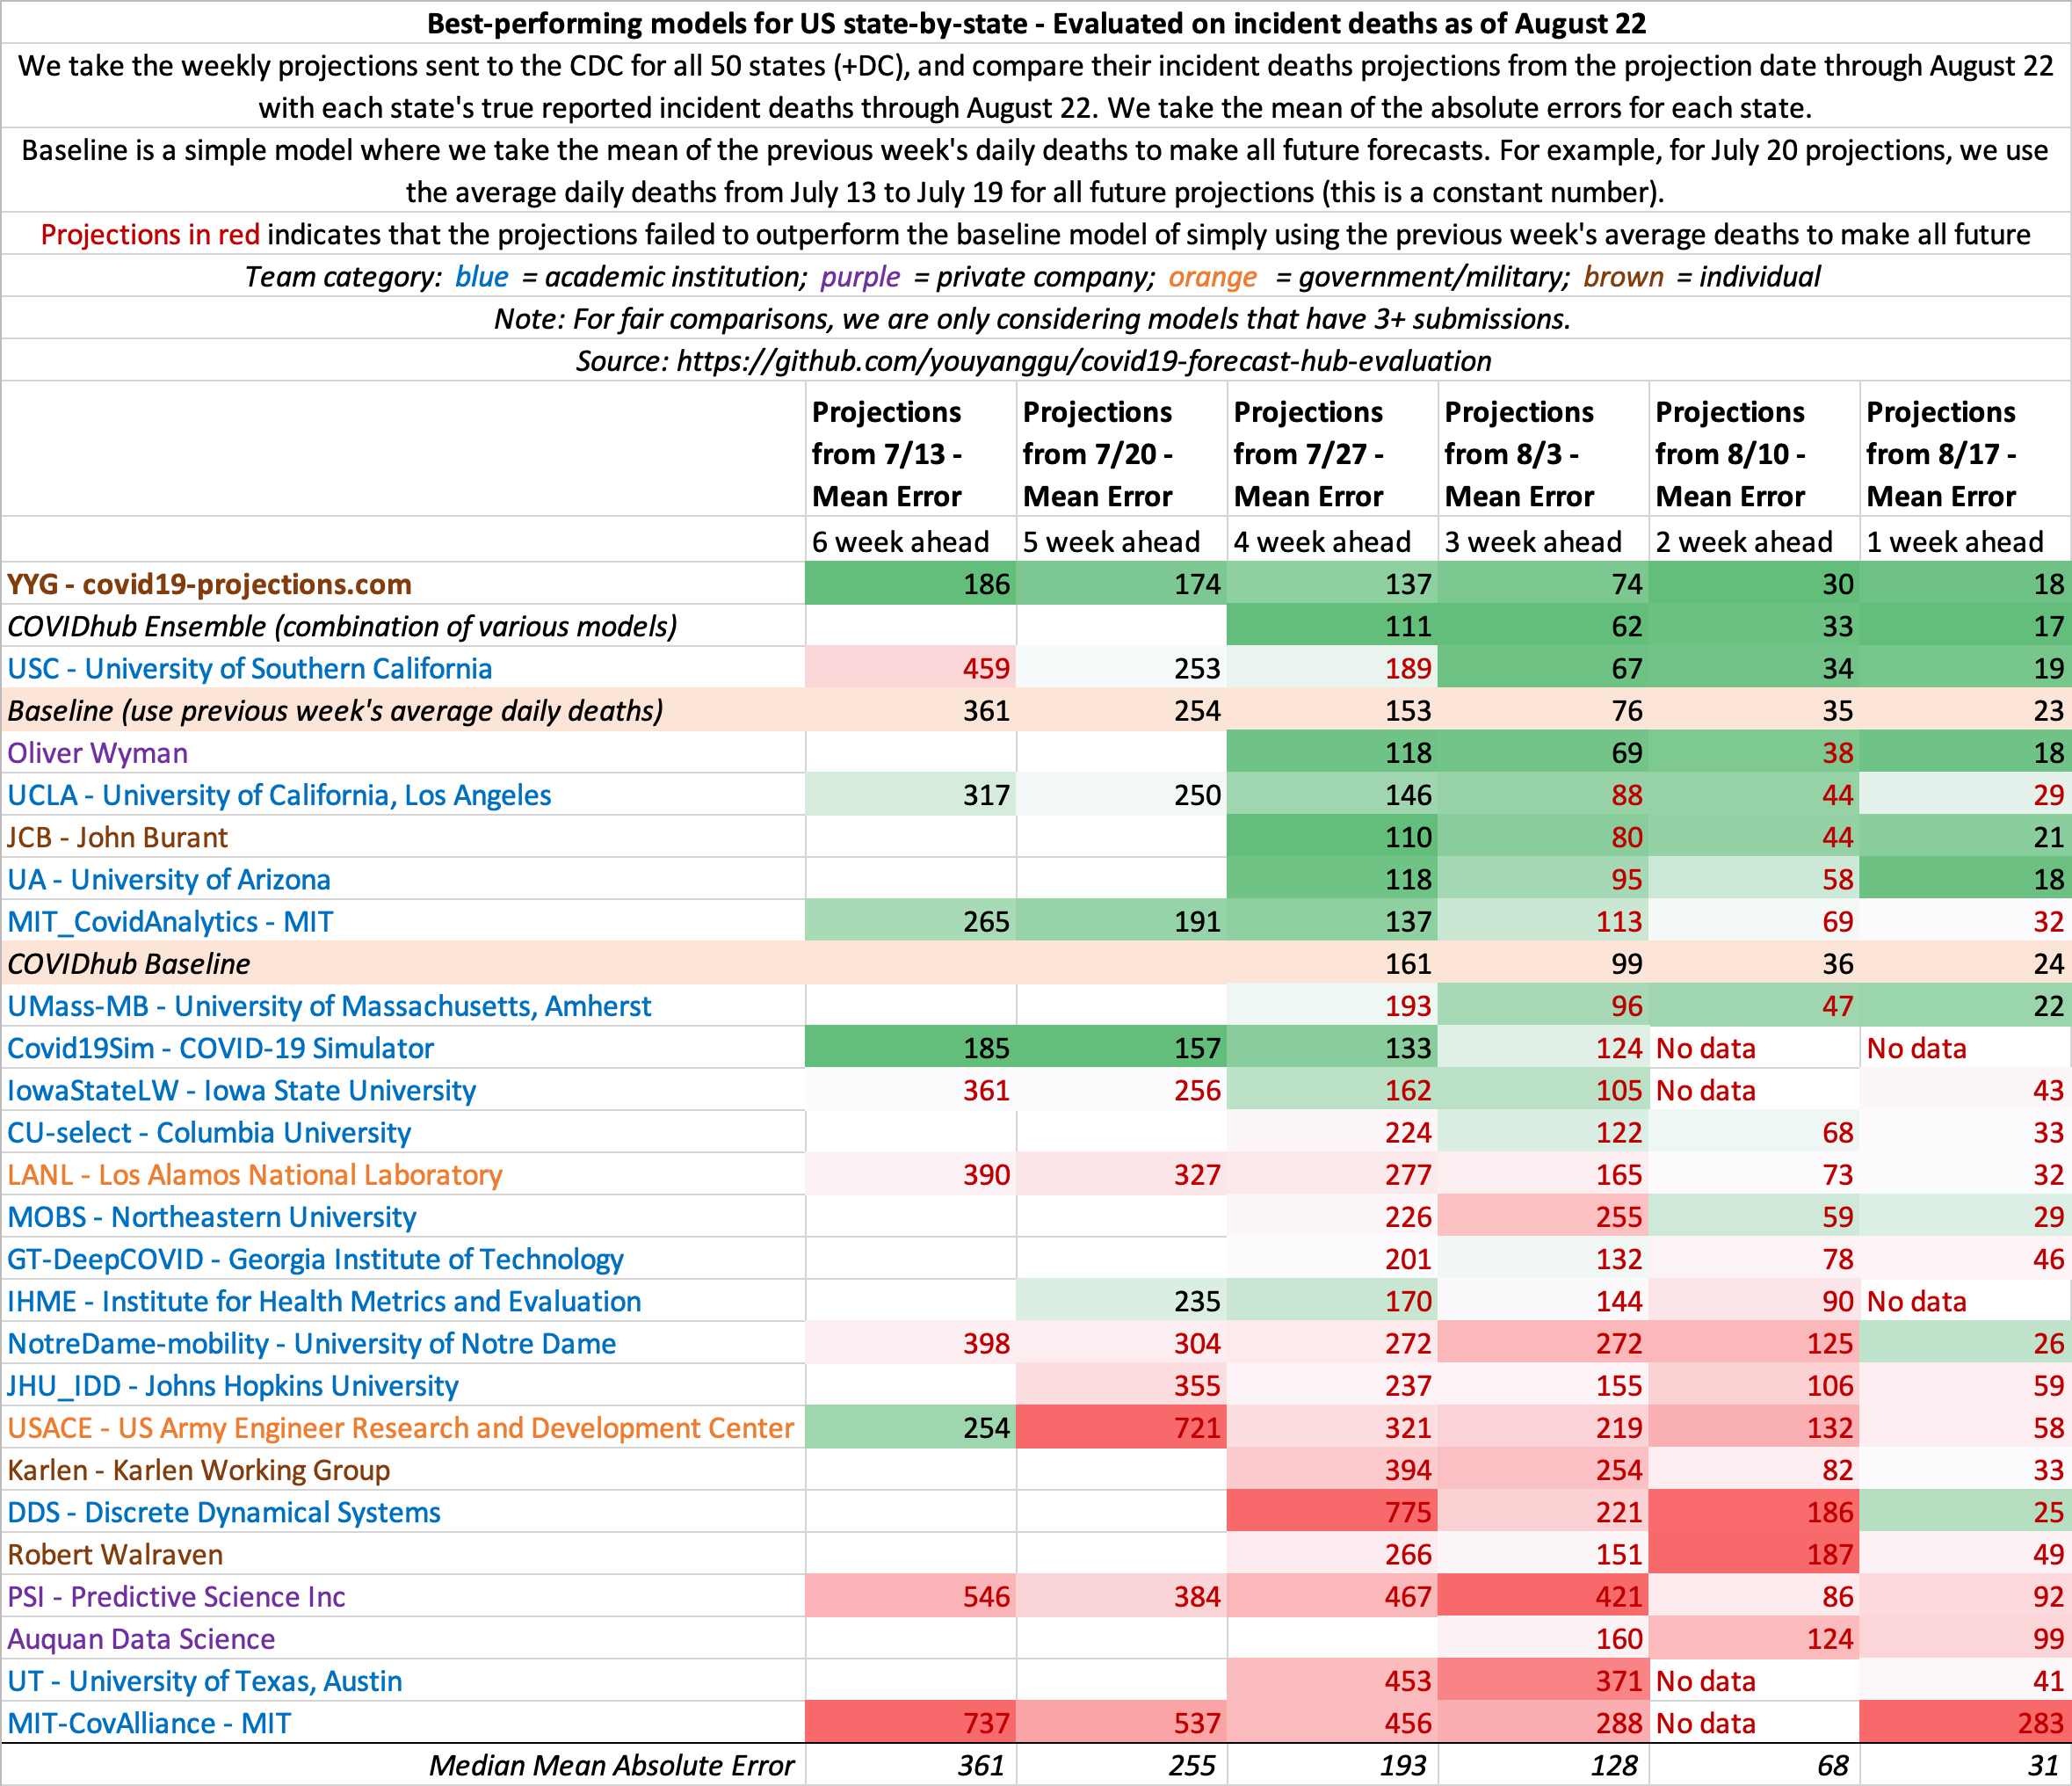
- August 22
- August 15
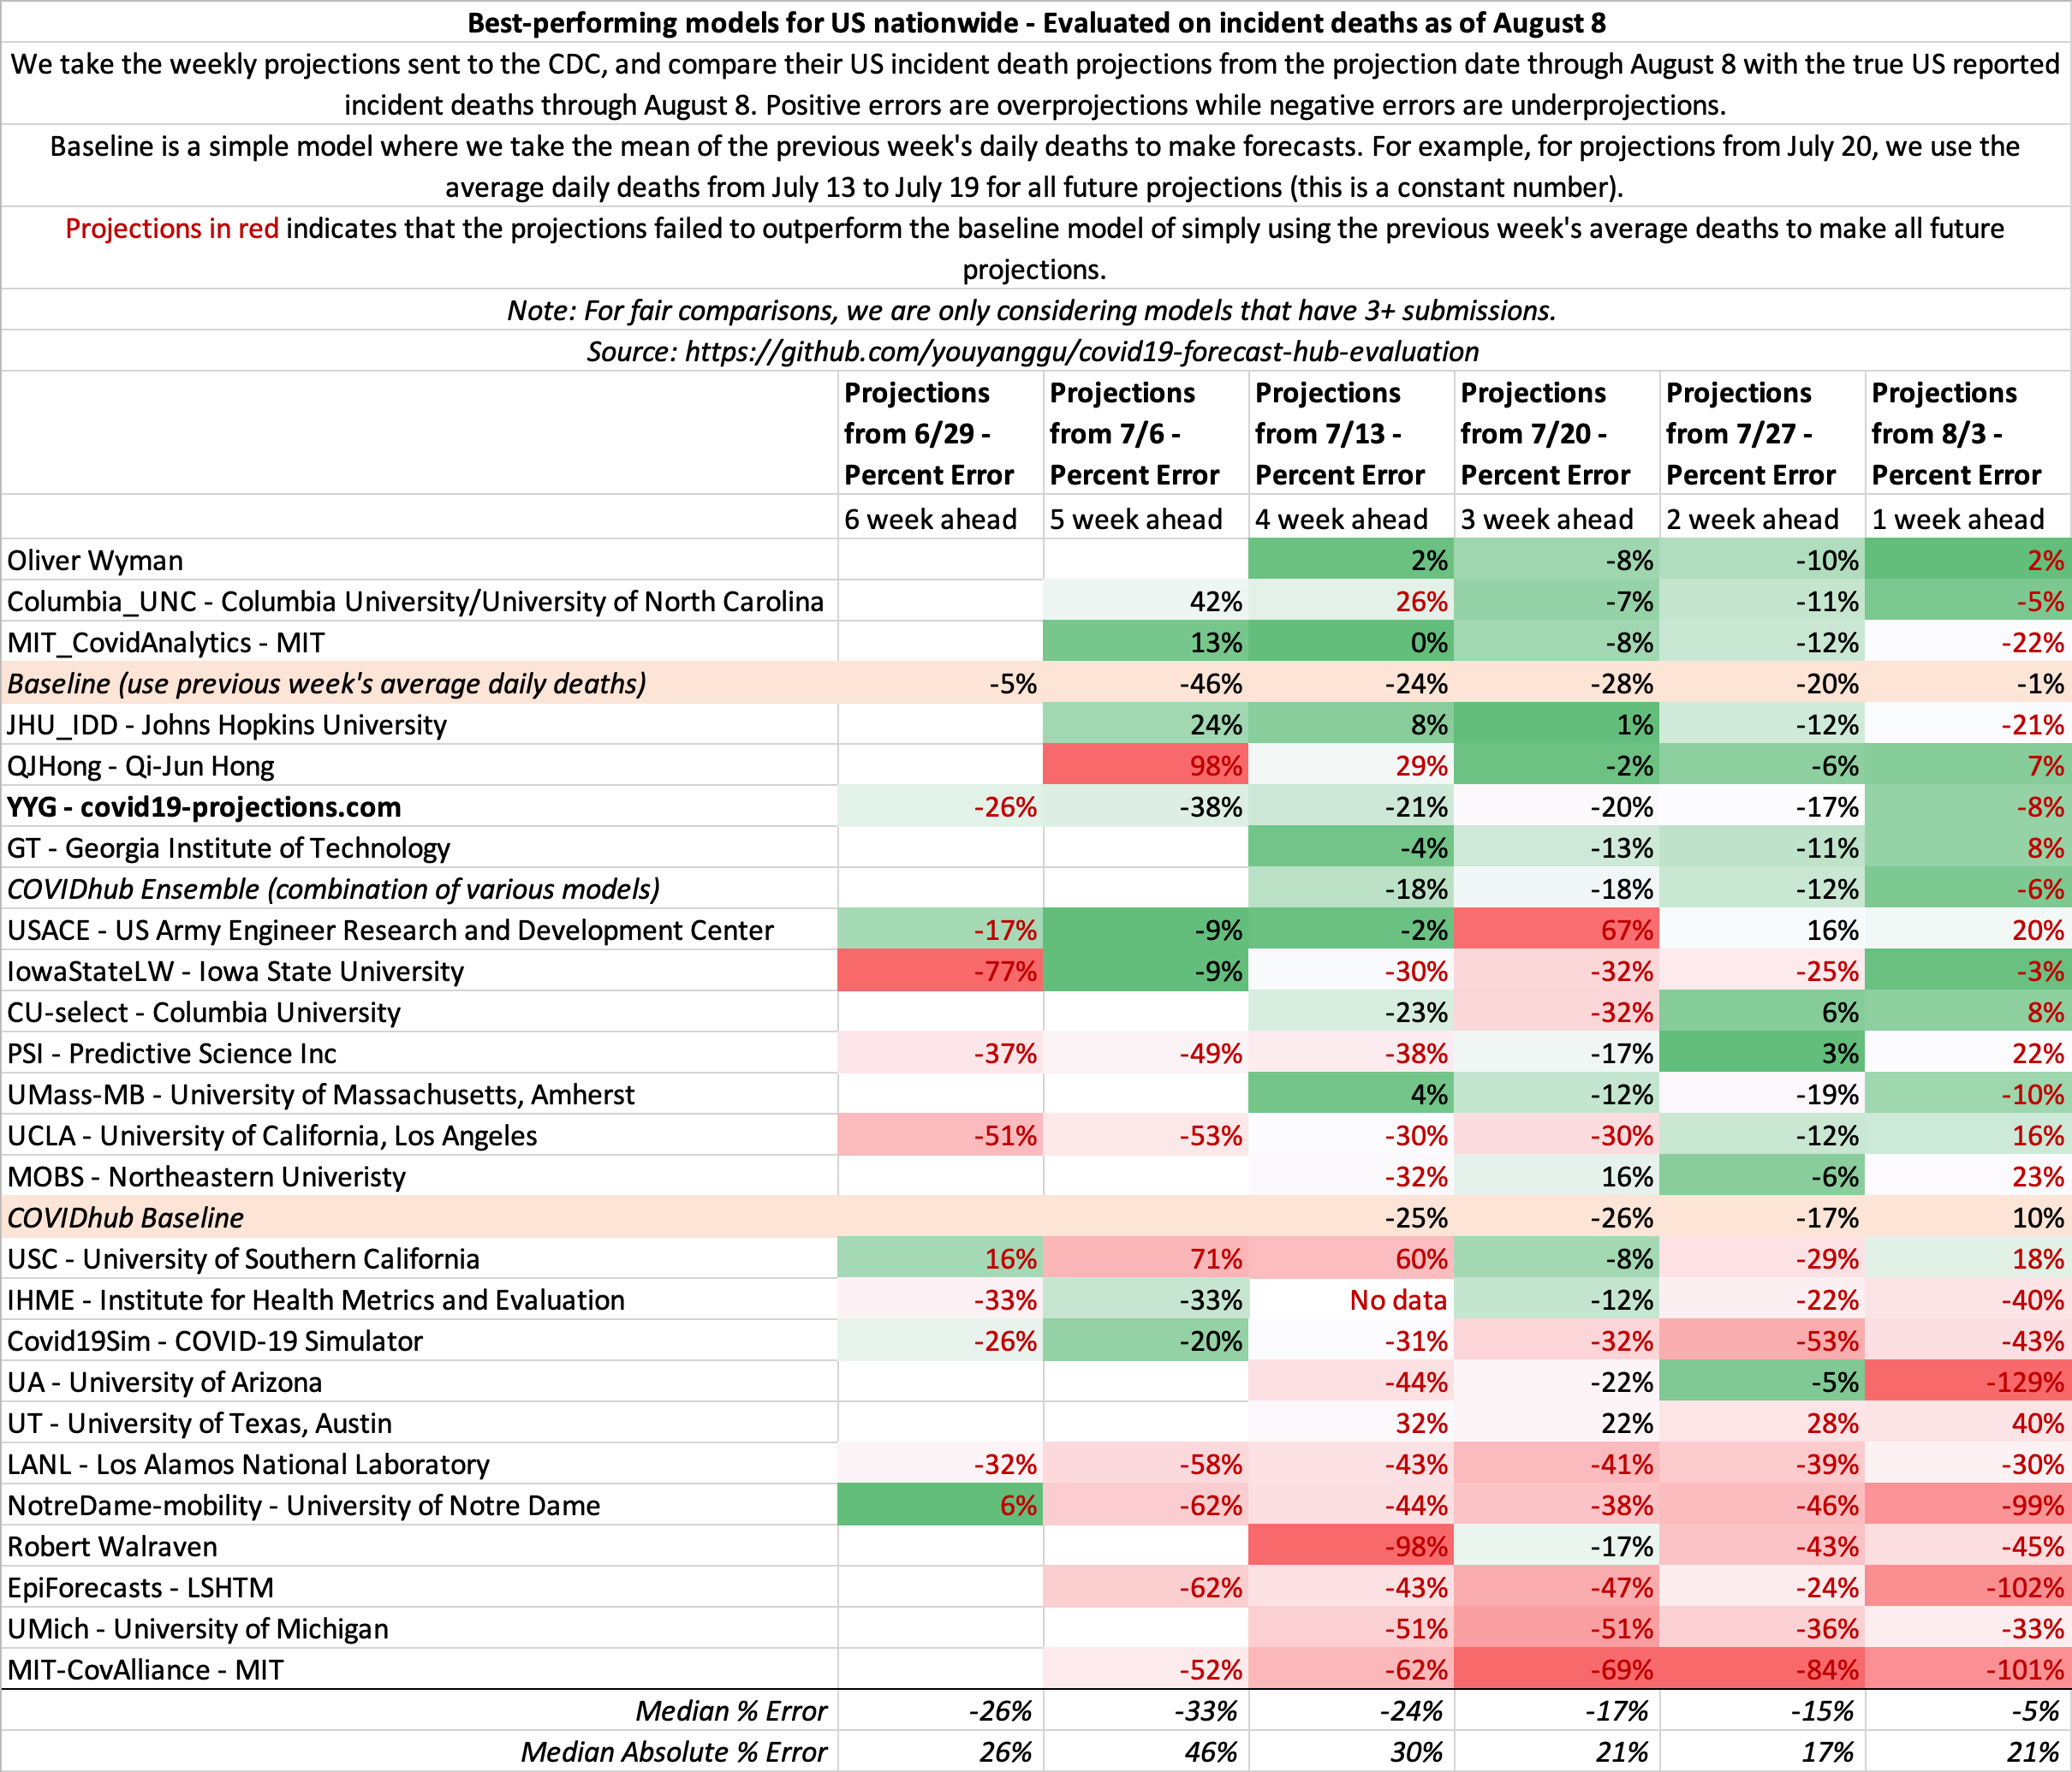
- August 8
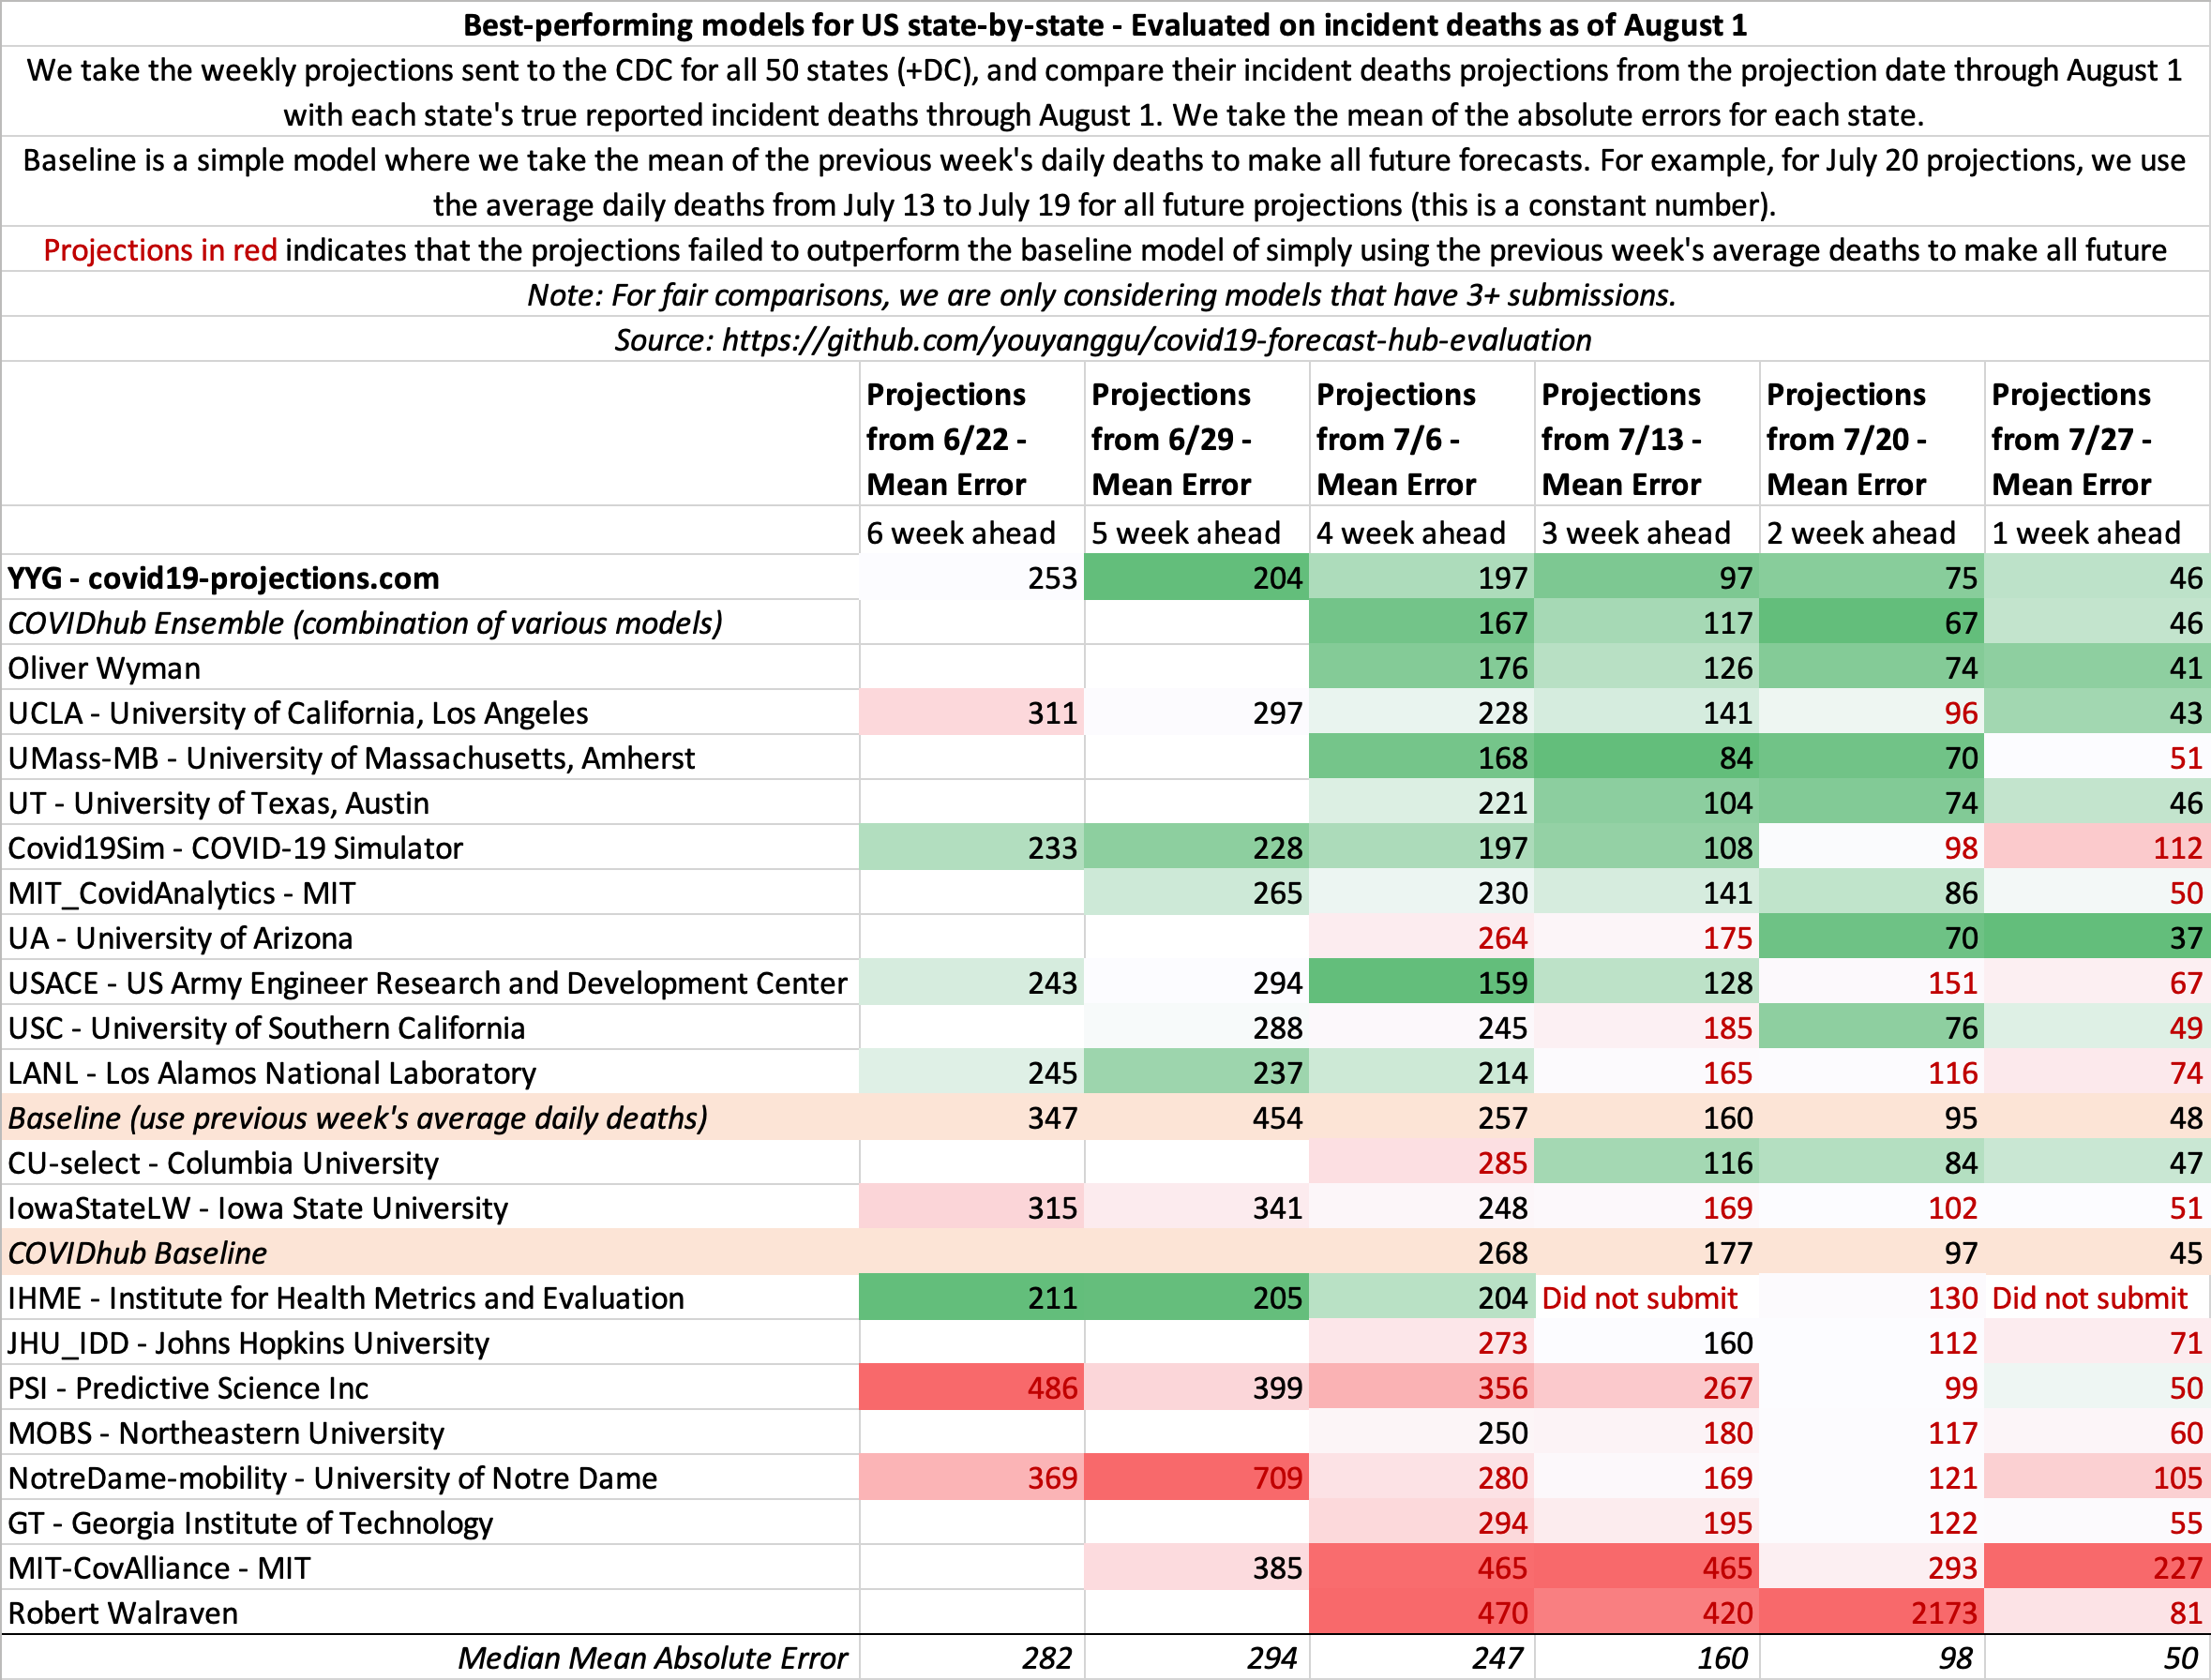
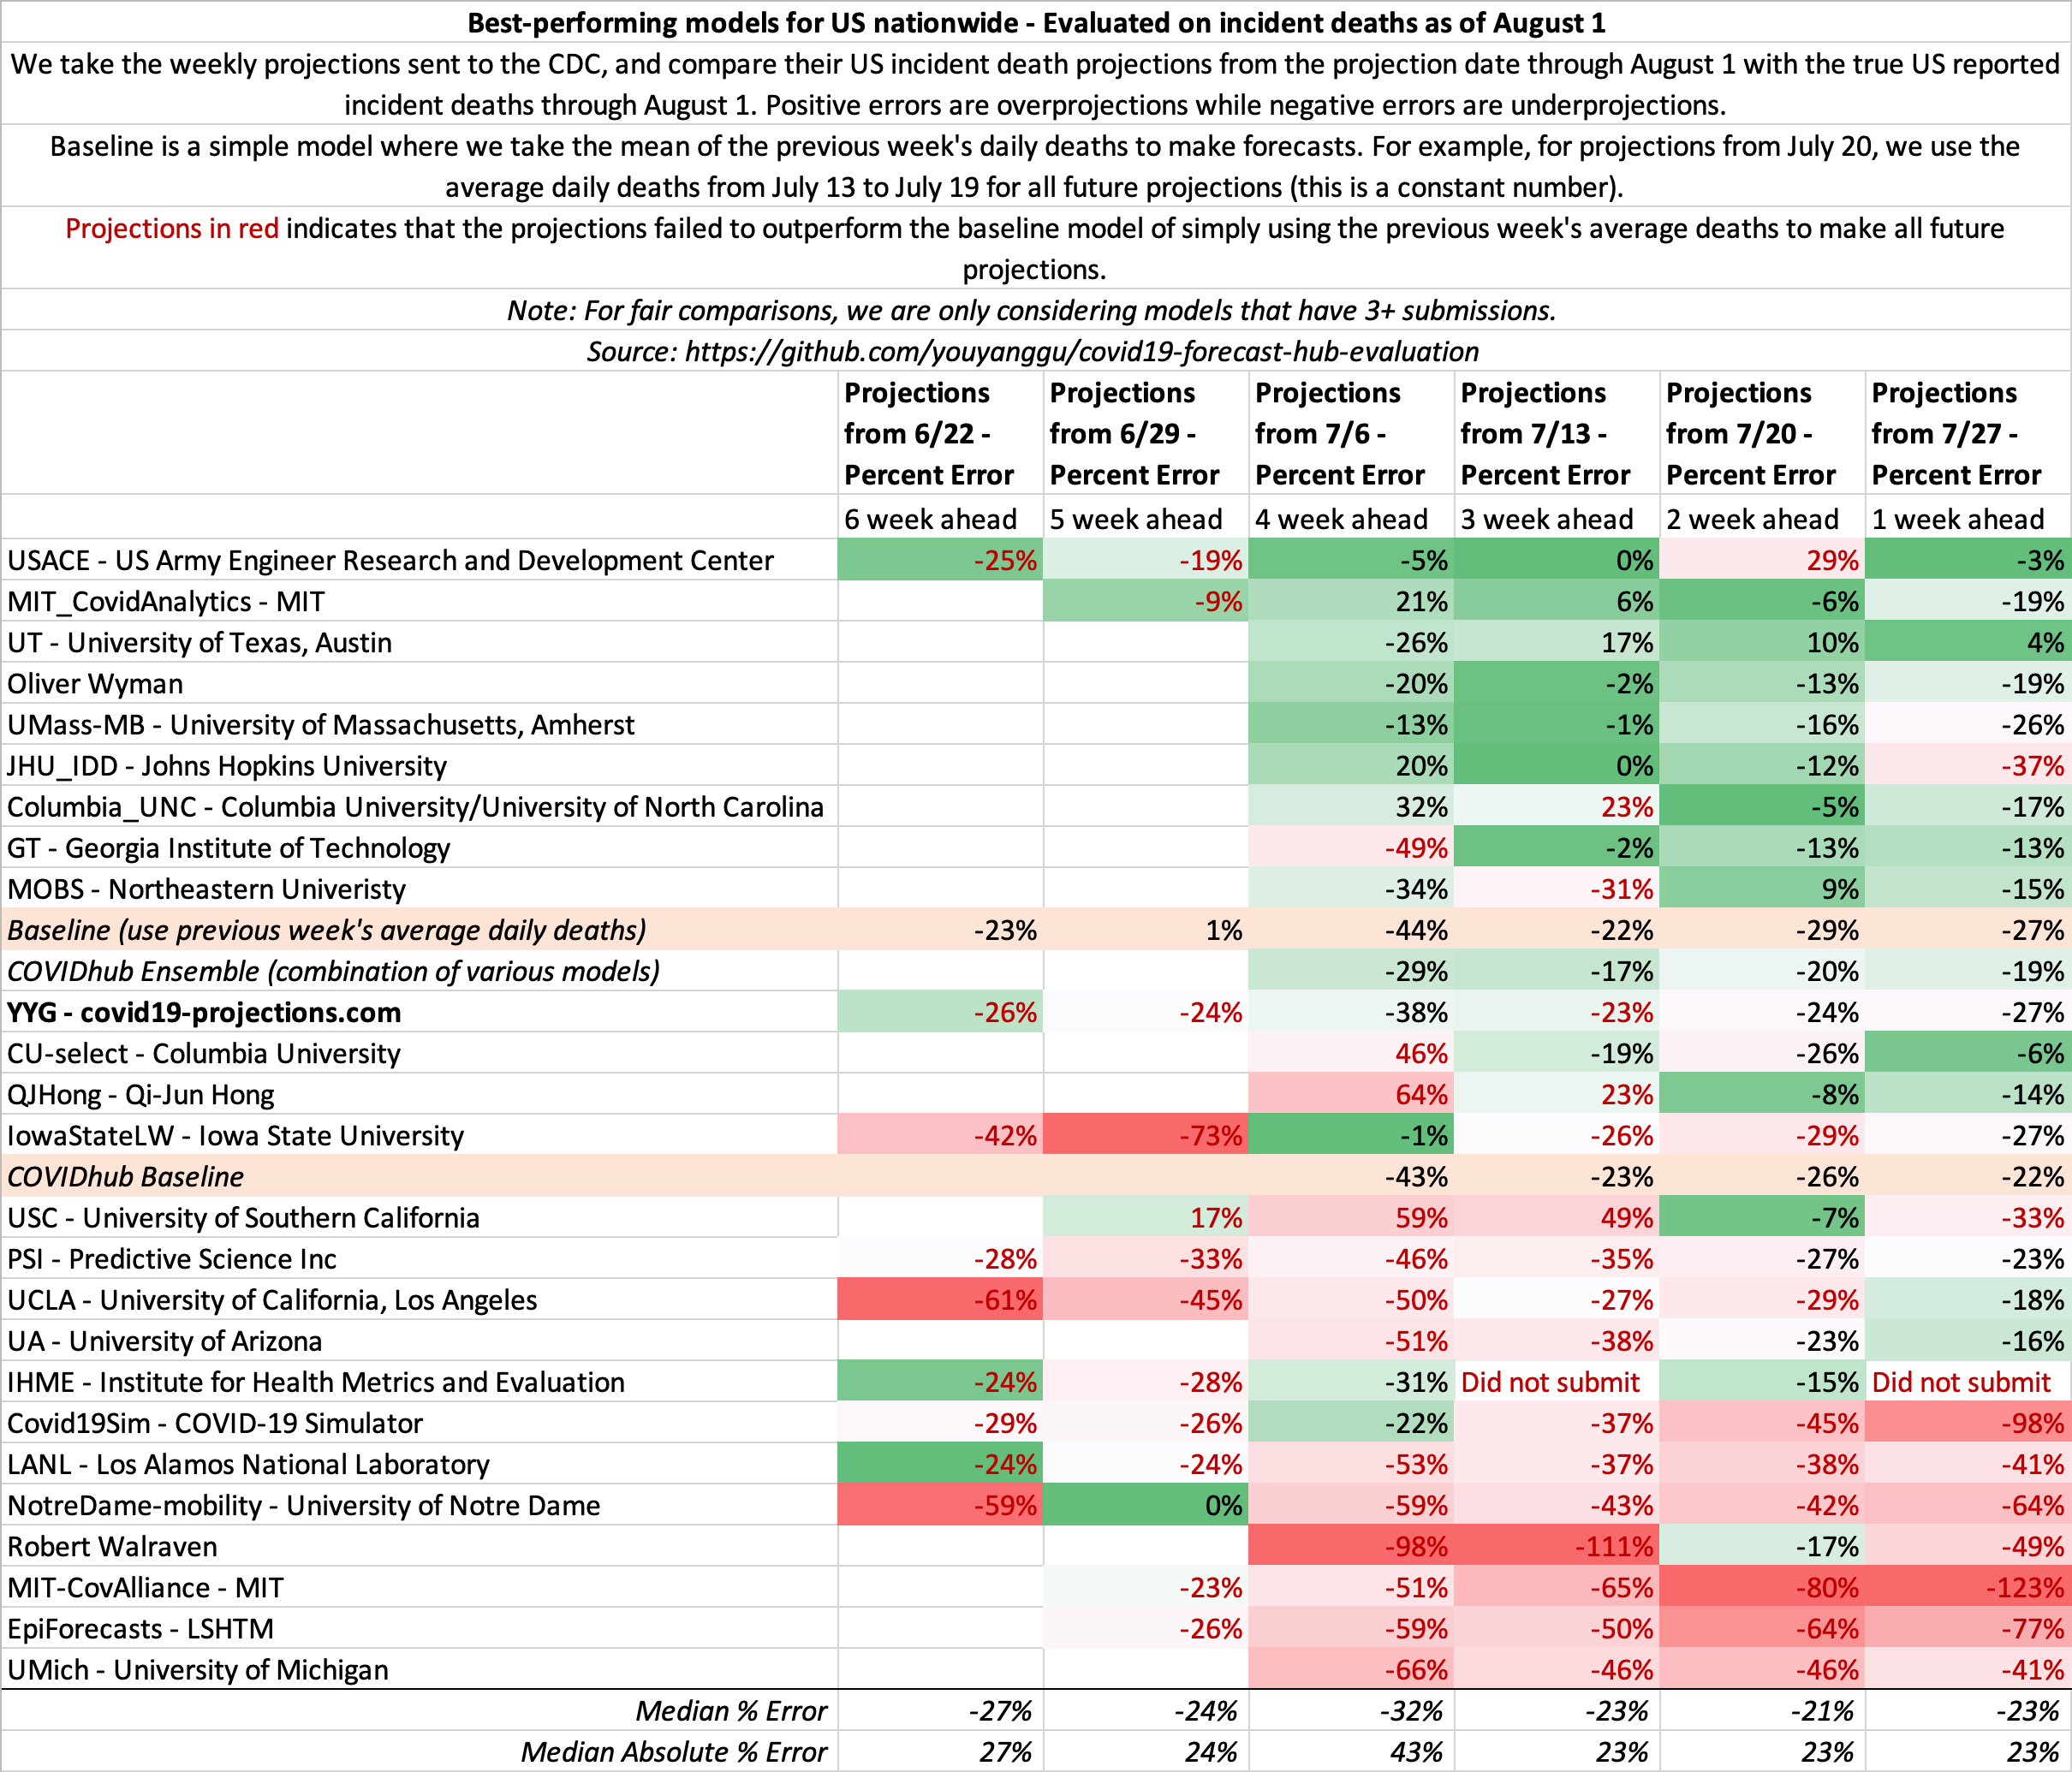
- August 1
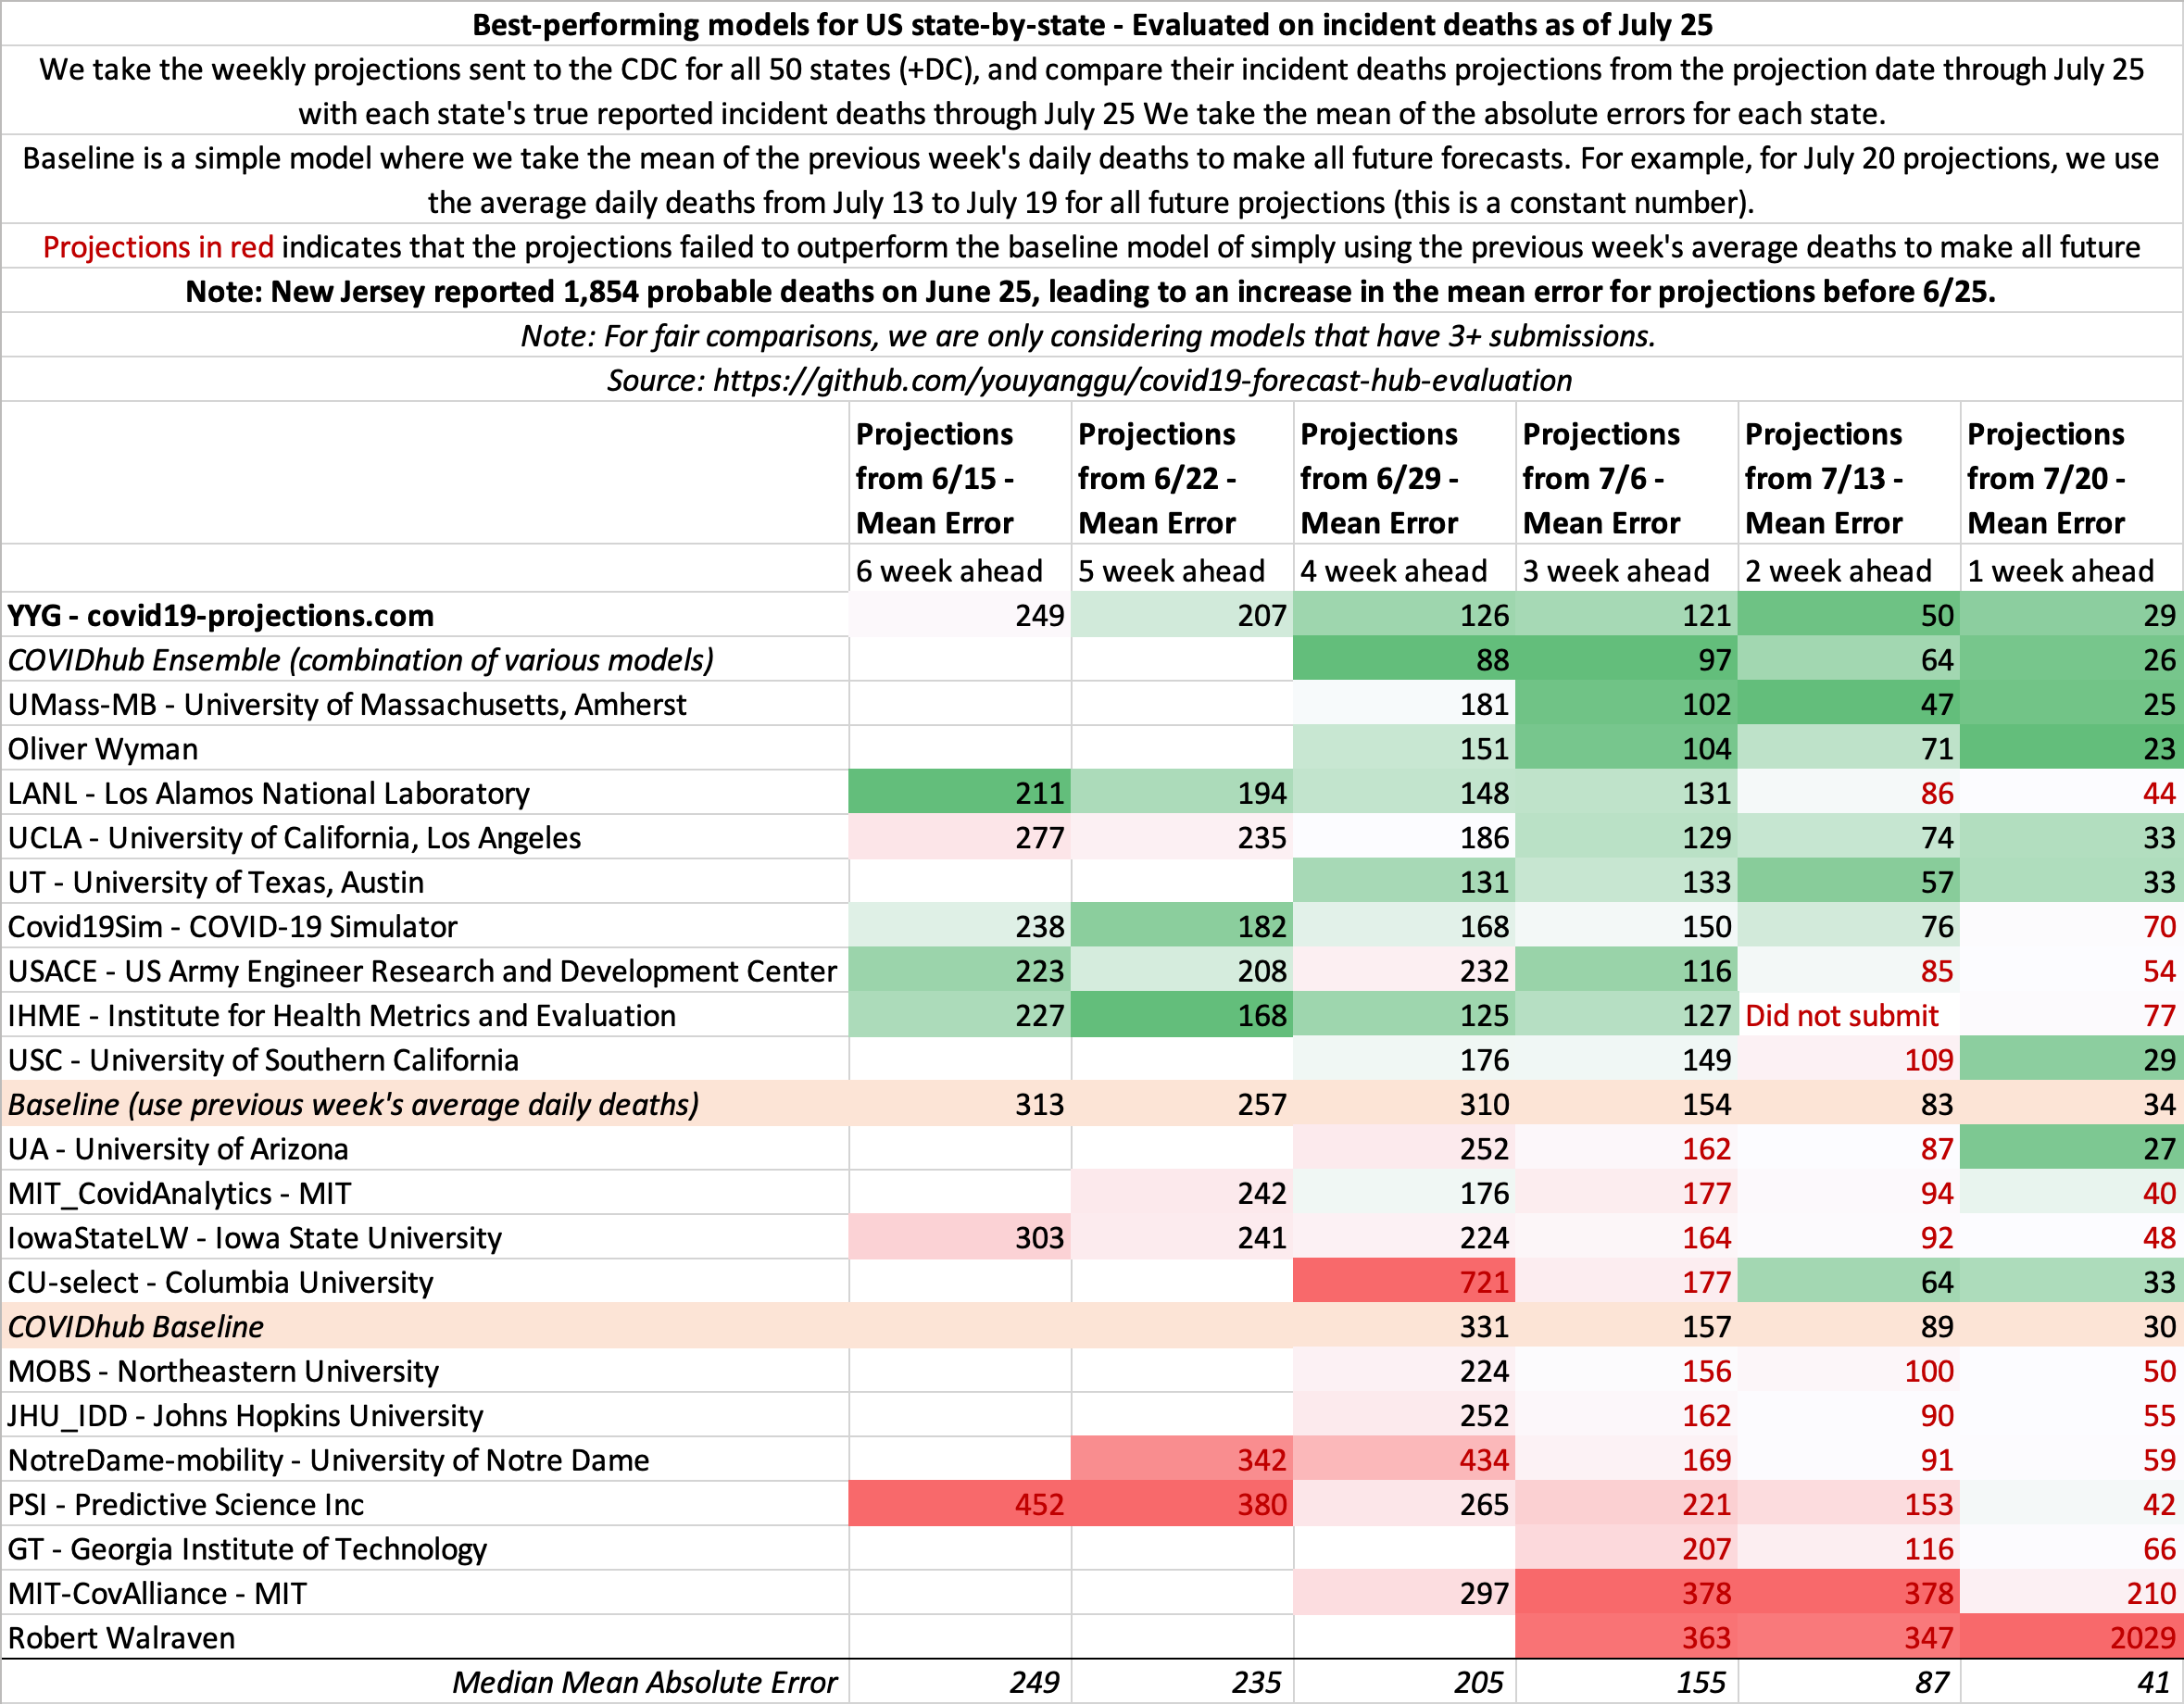
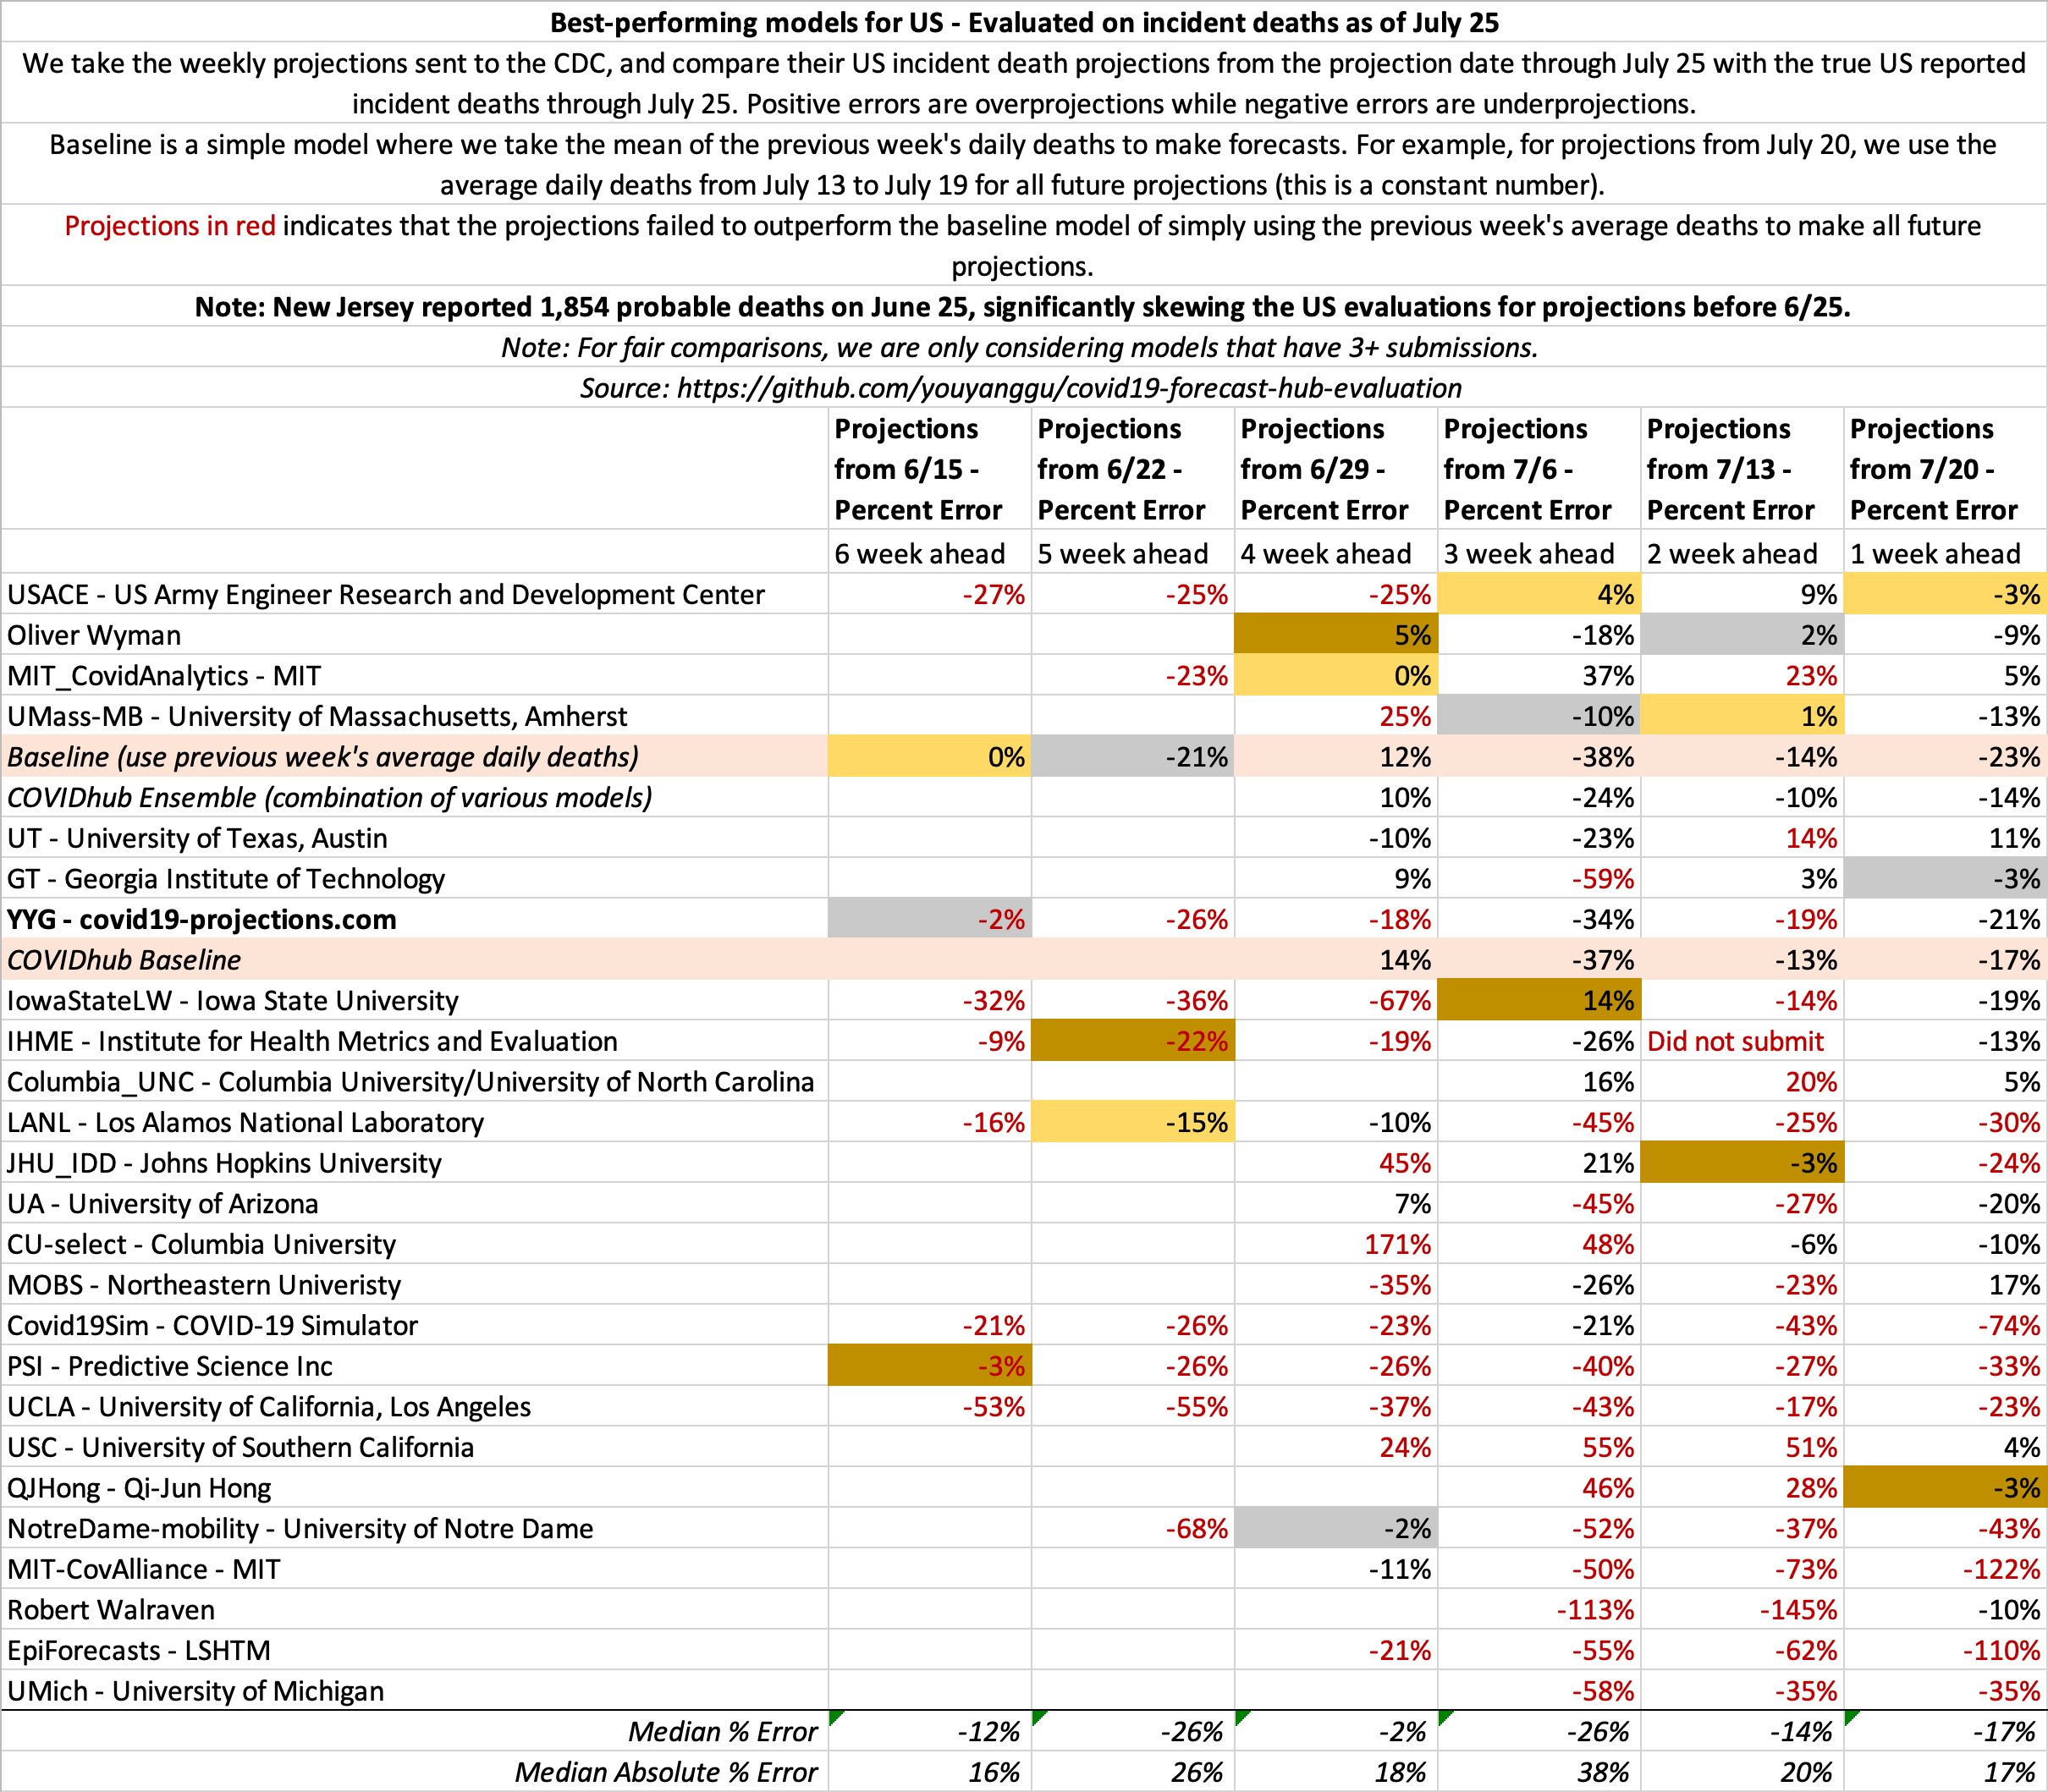
- July 25
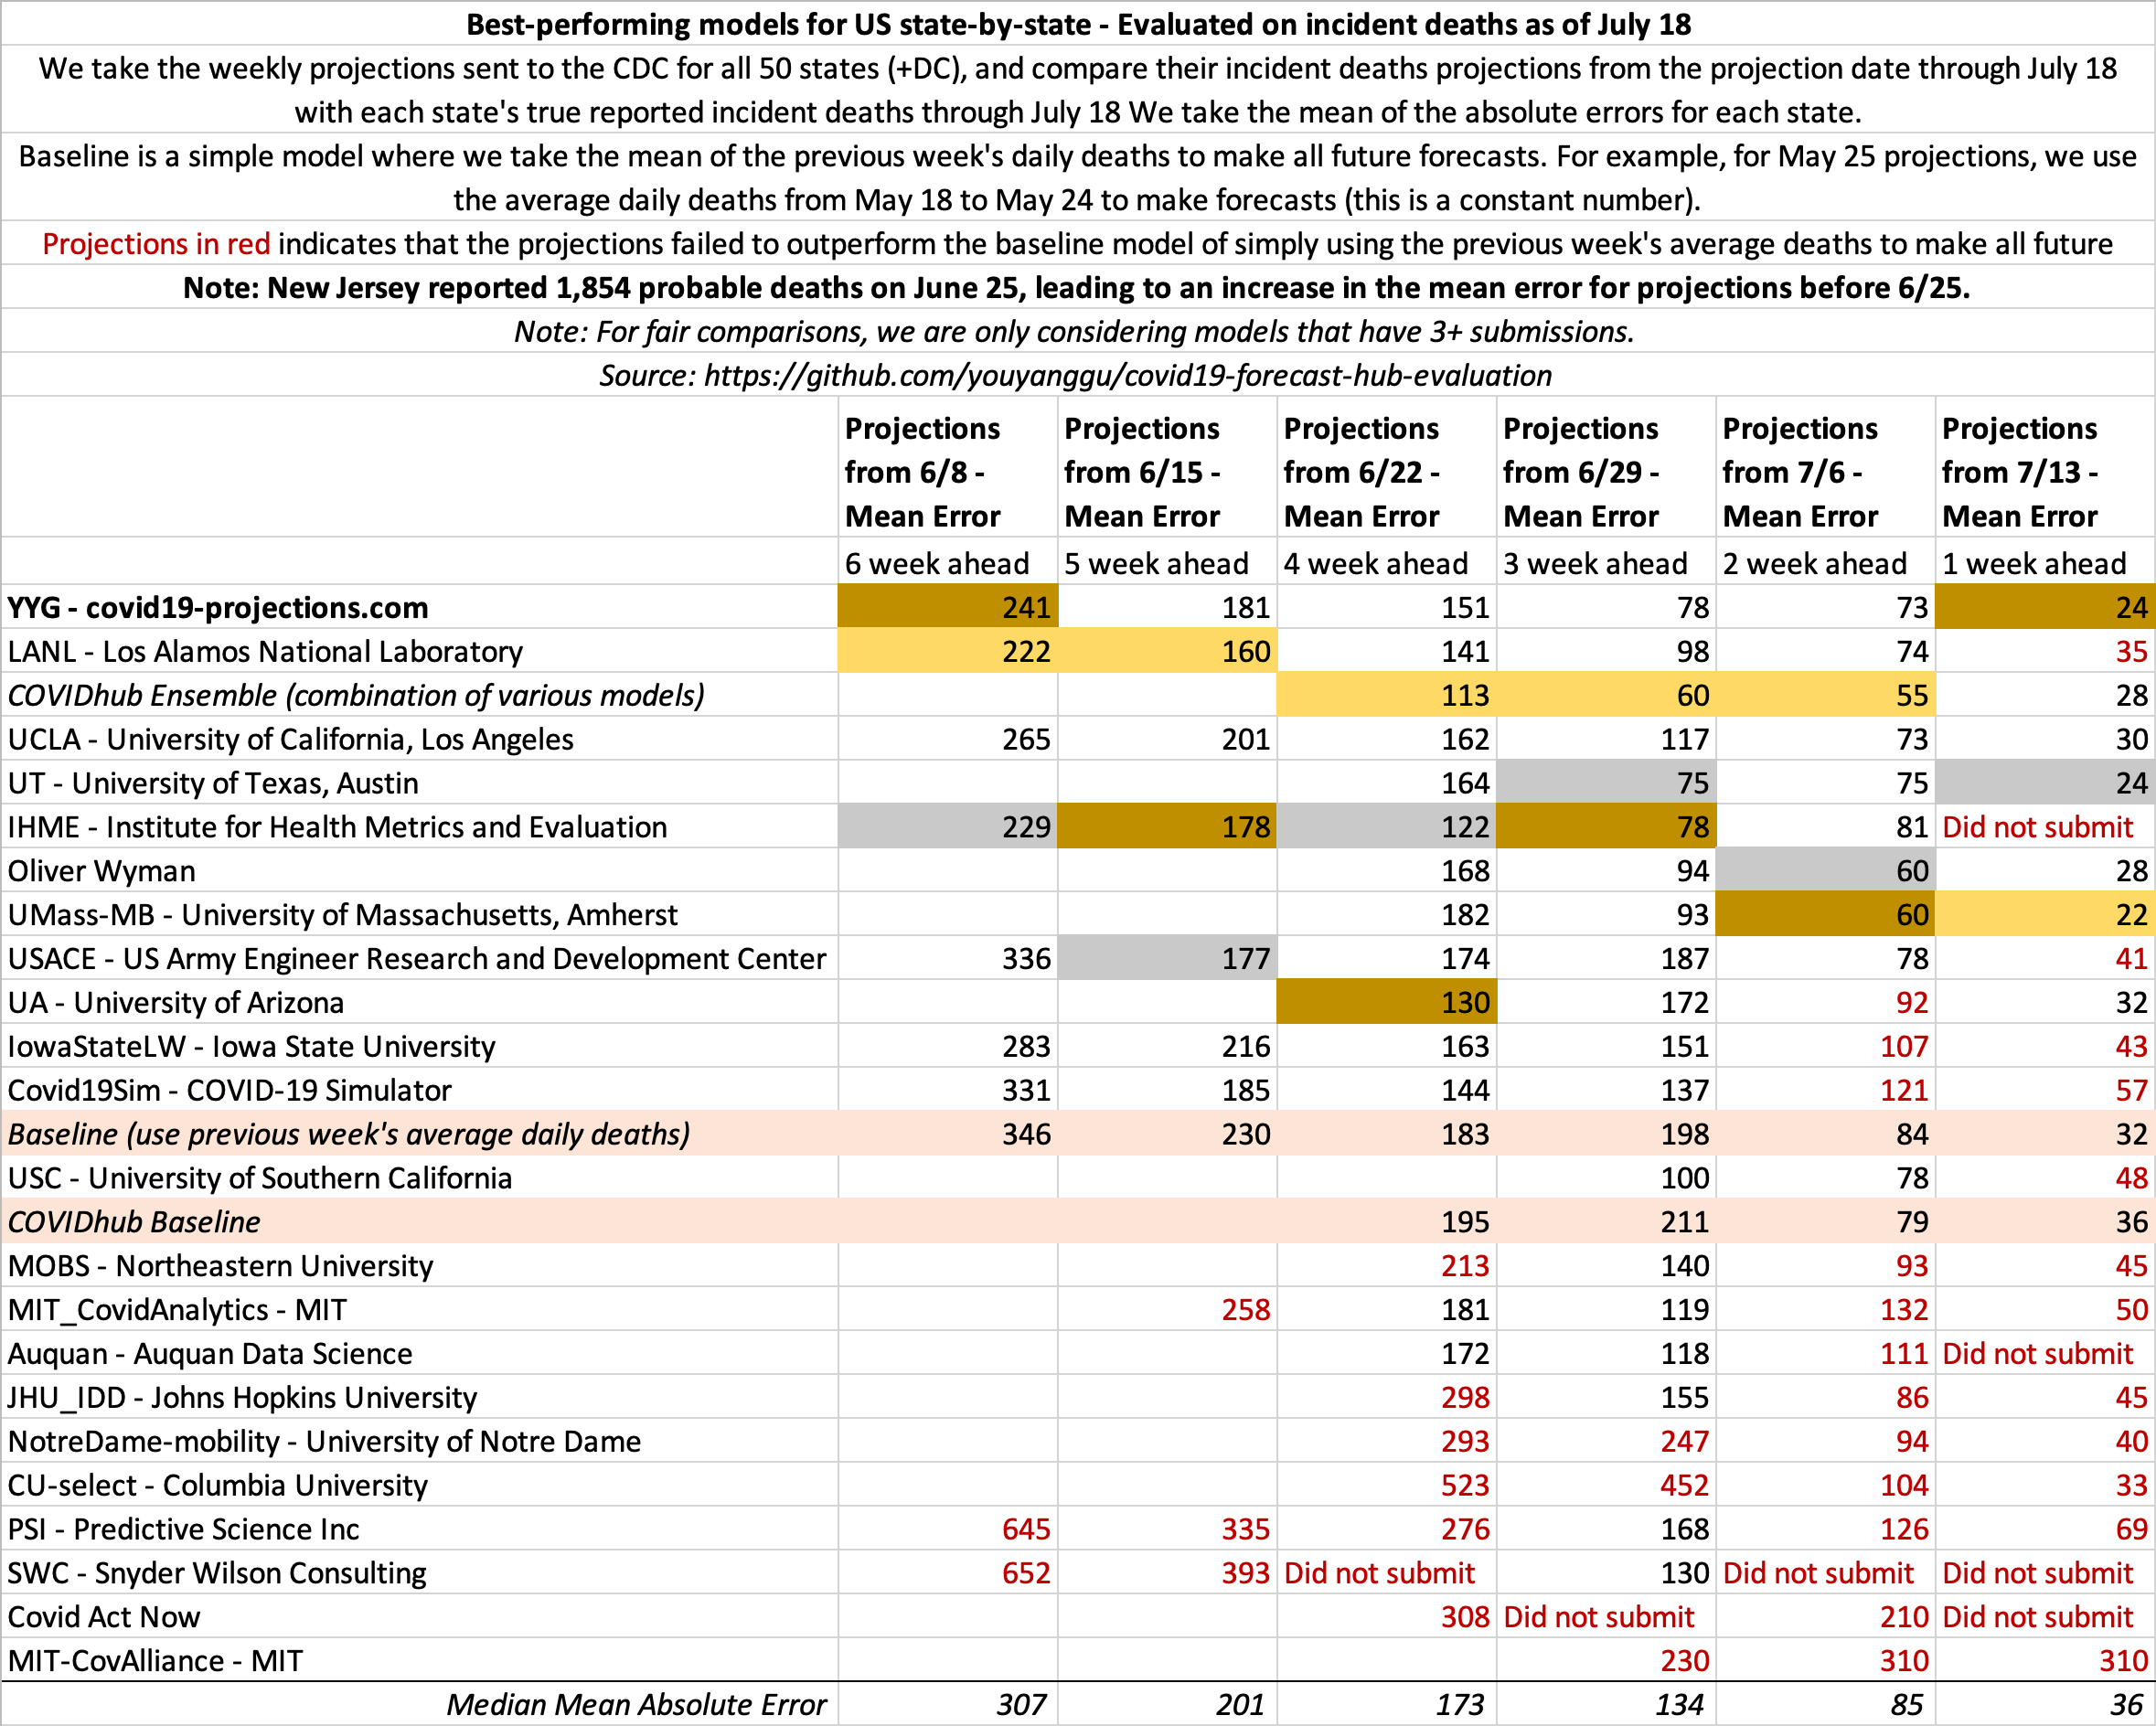
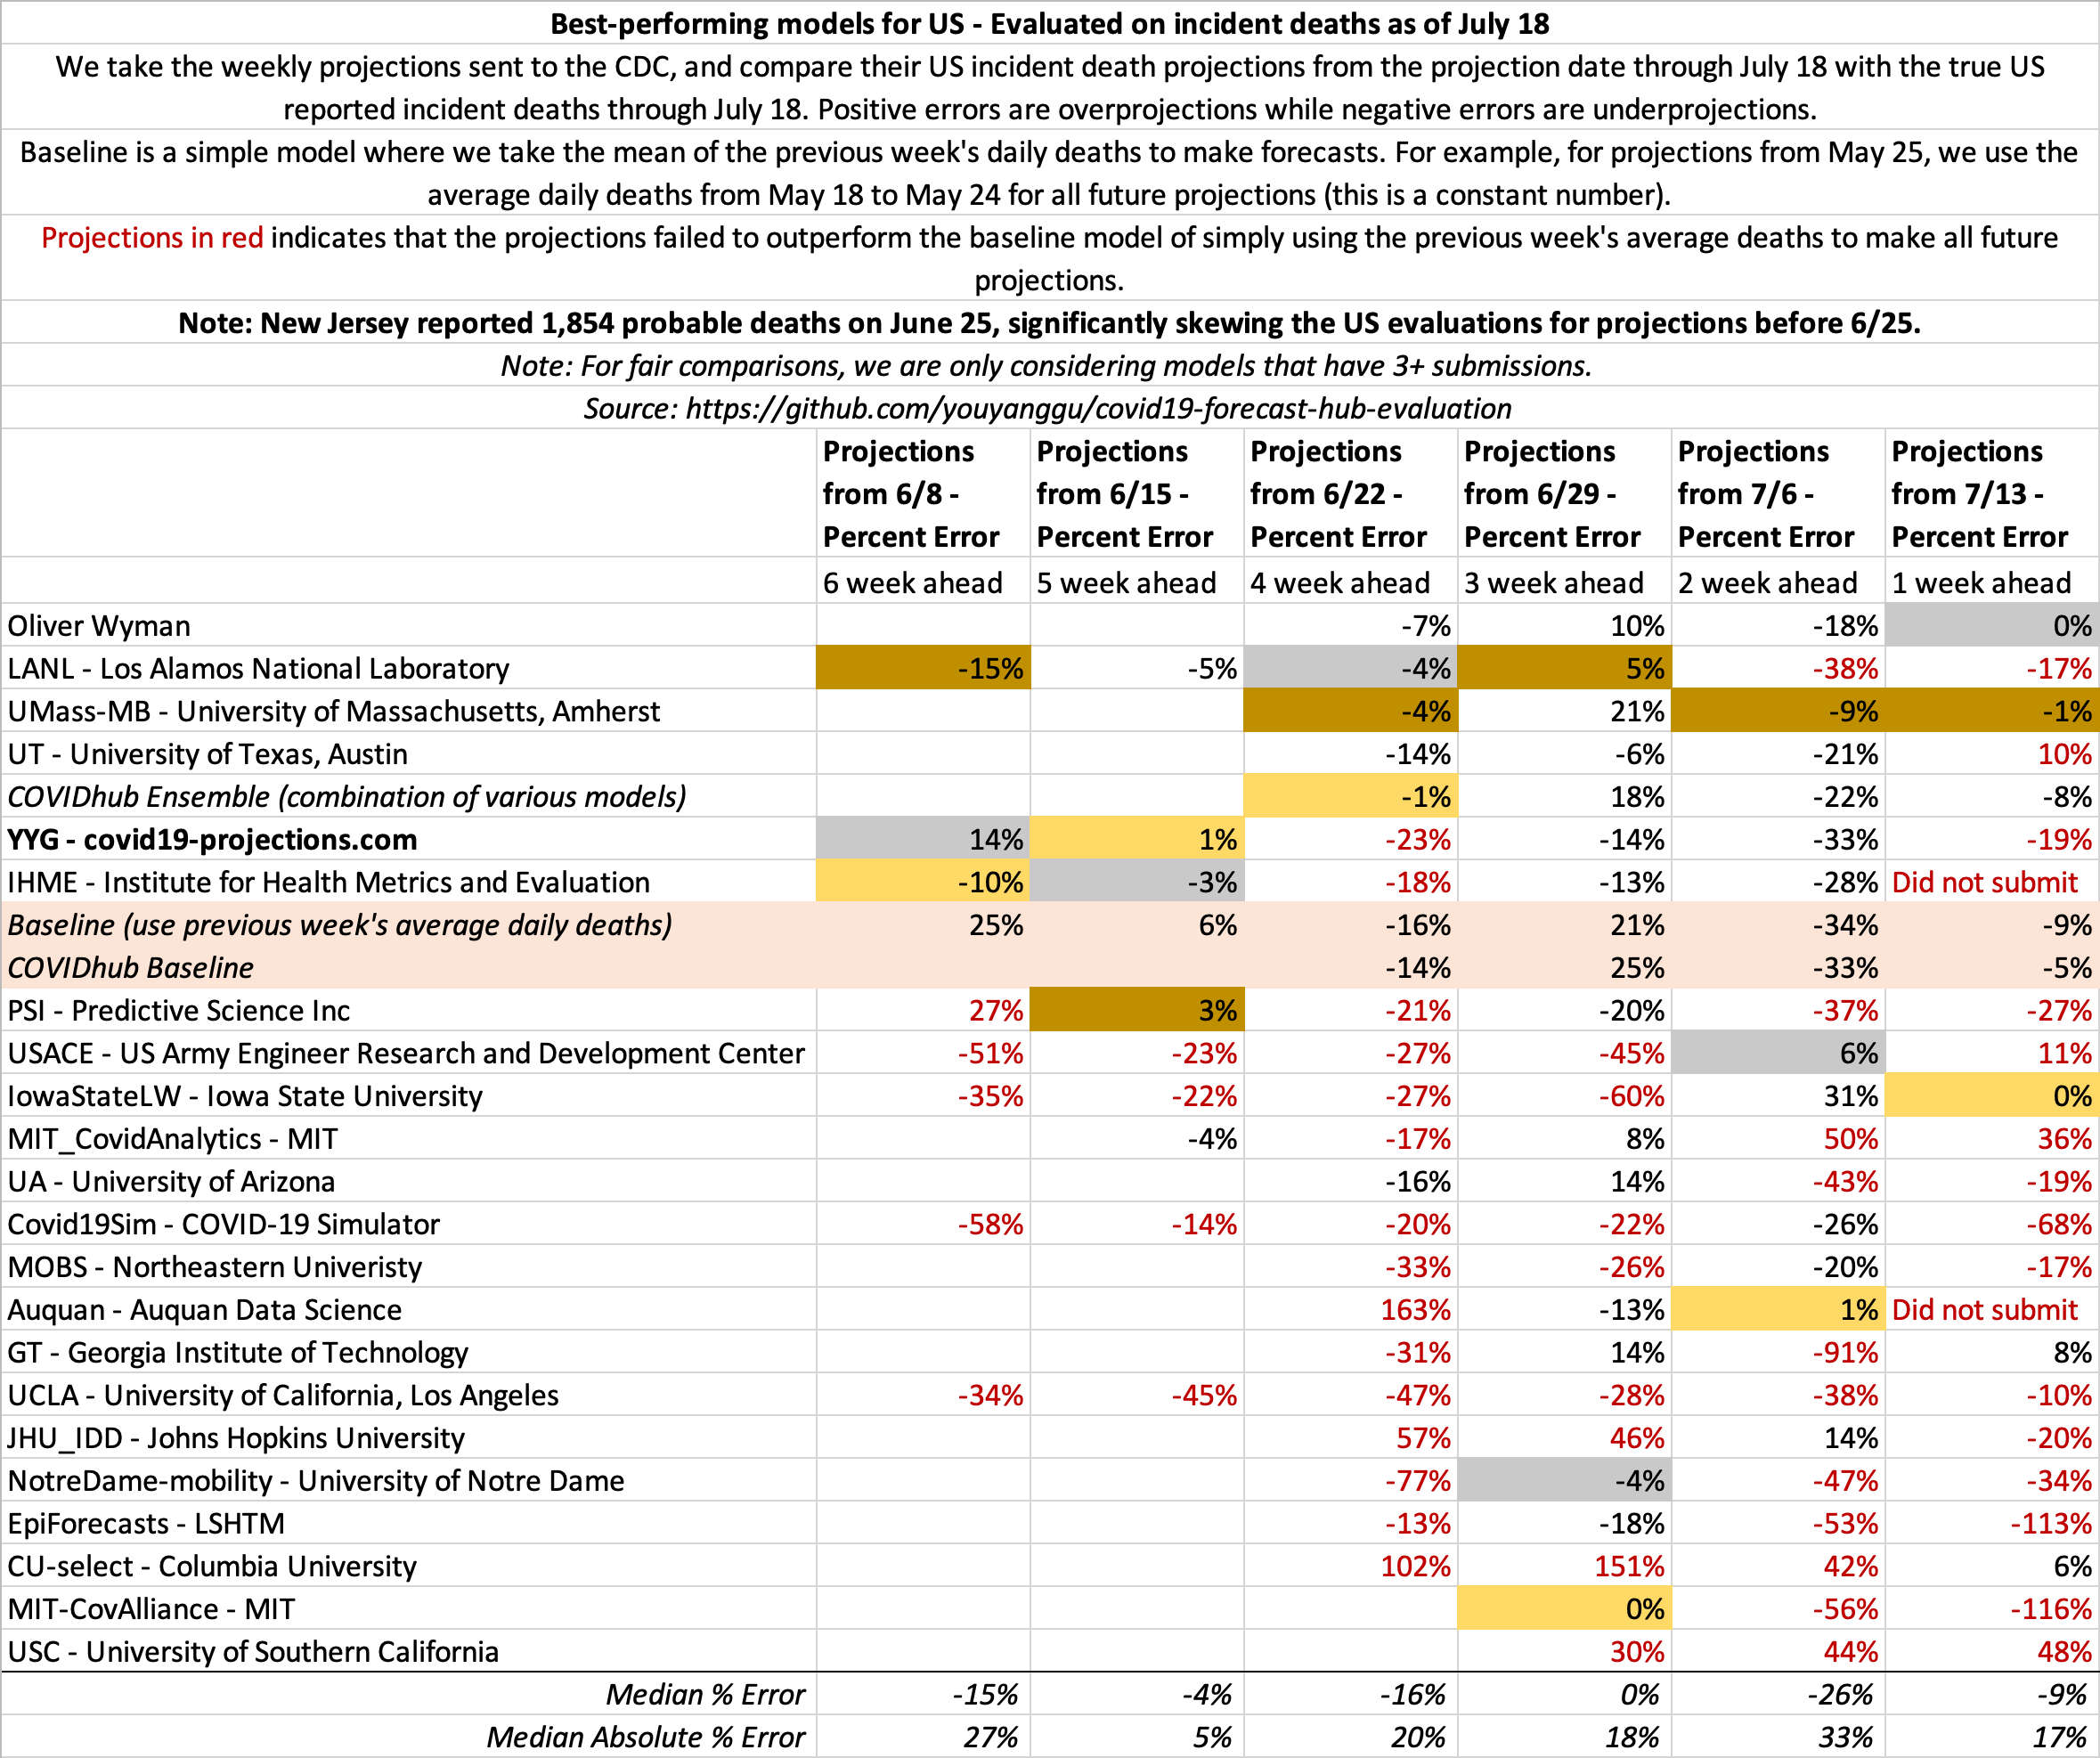
- July 18
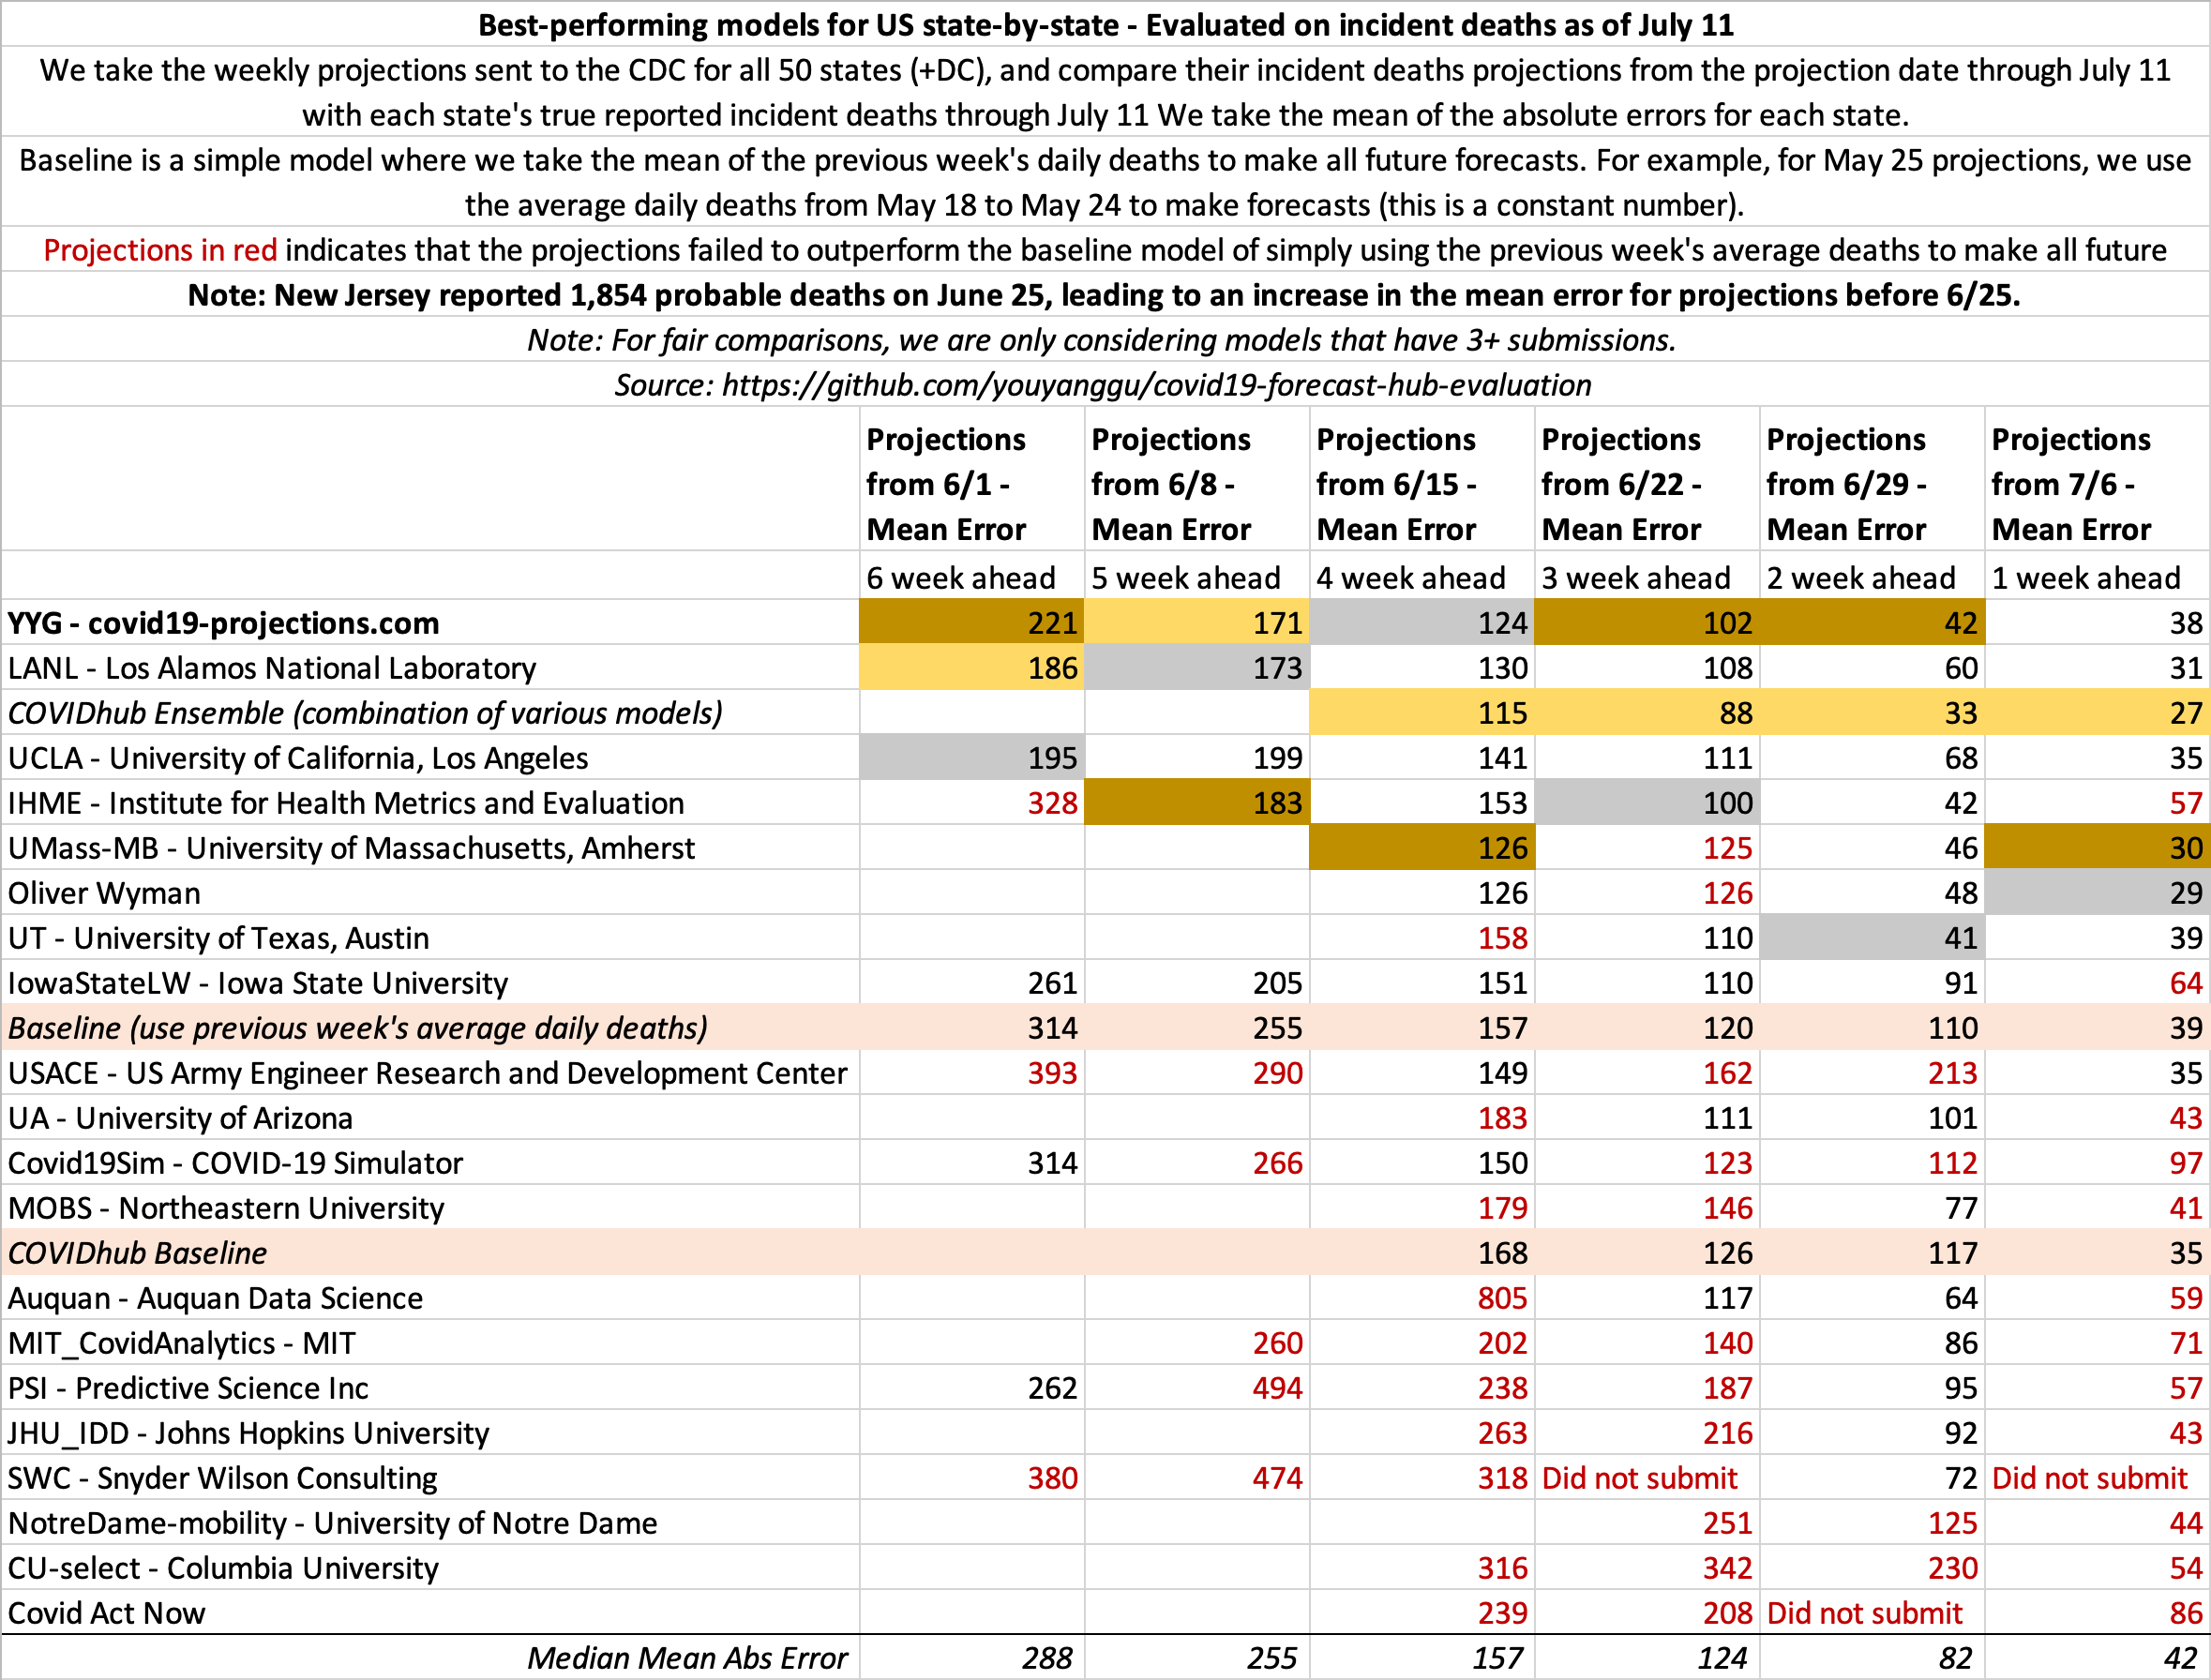
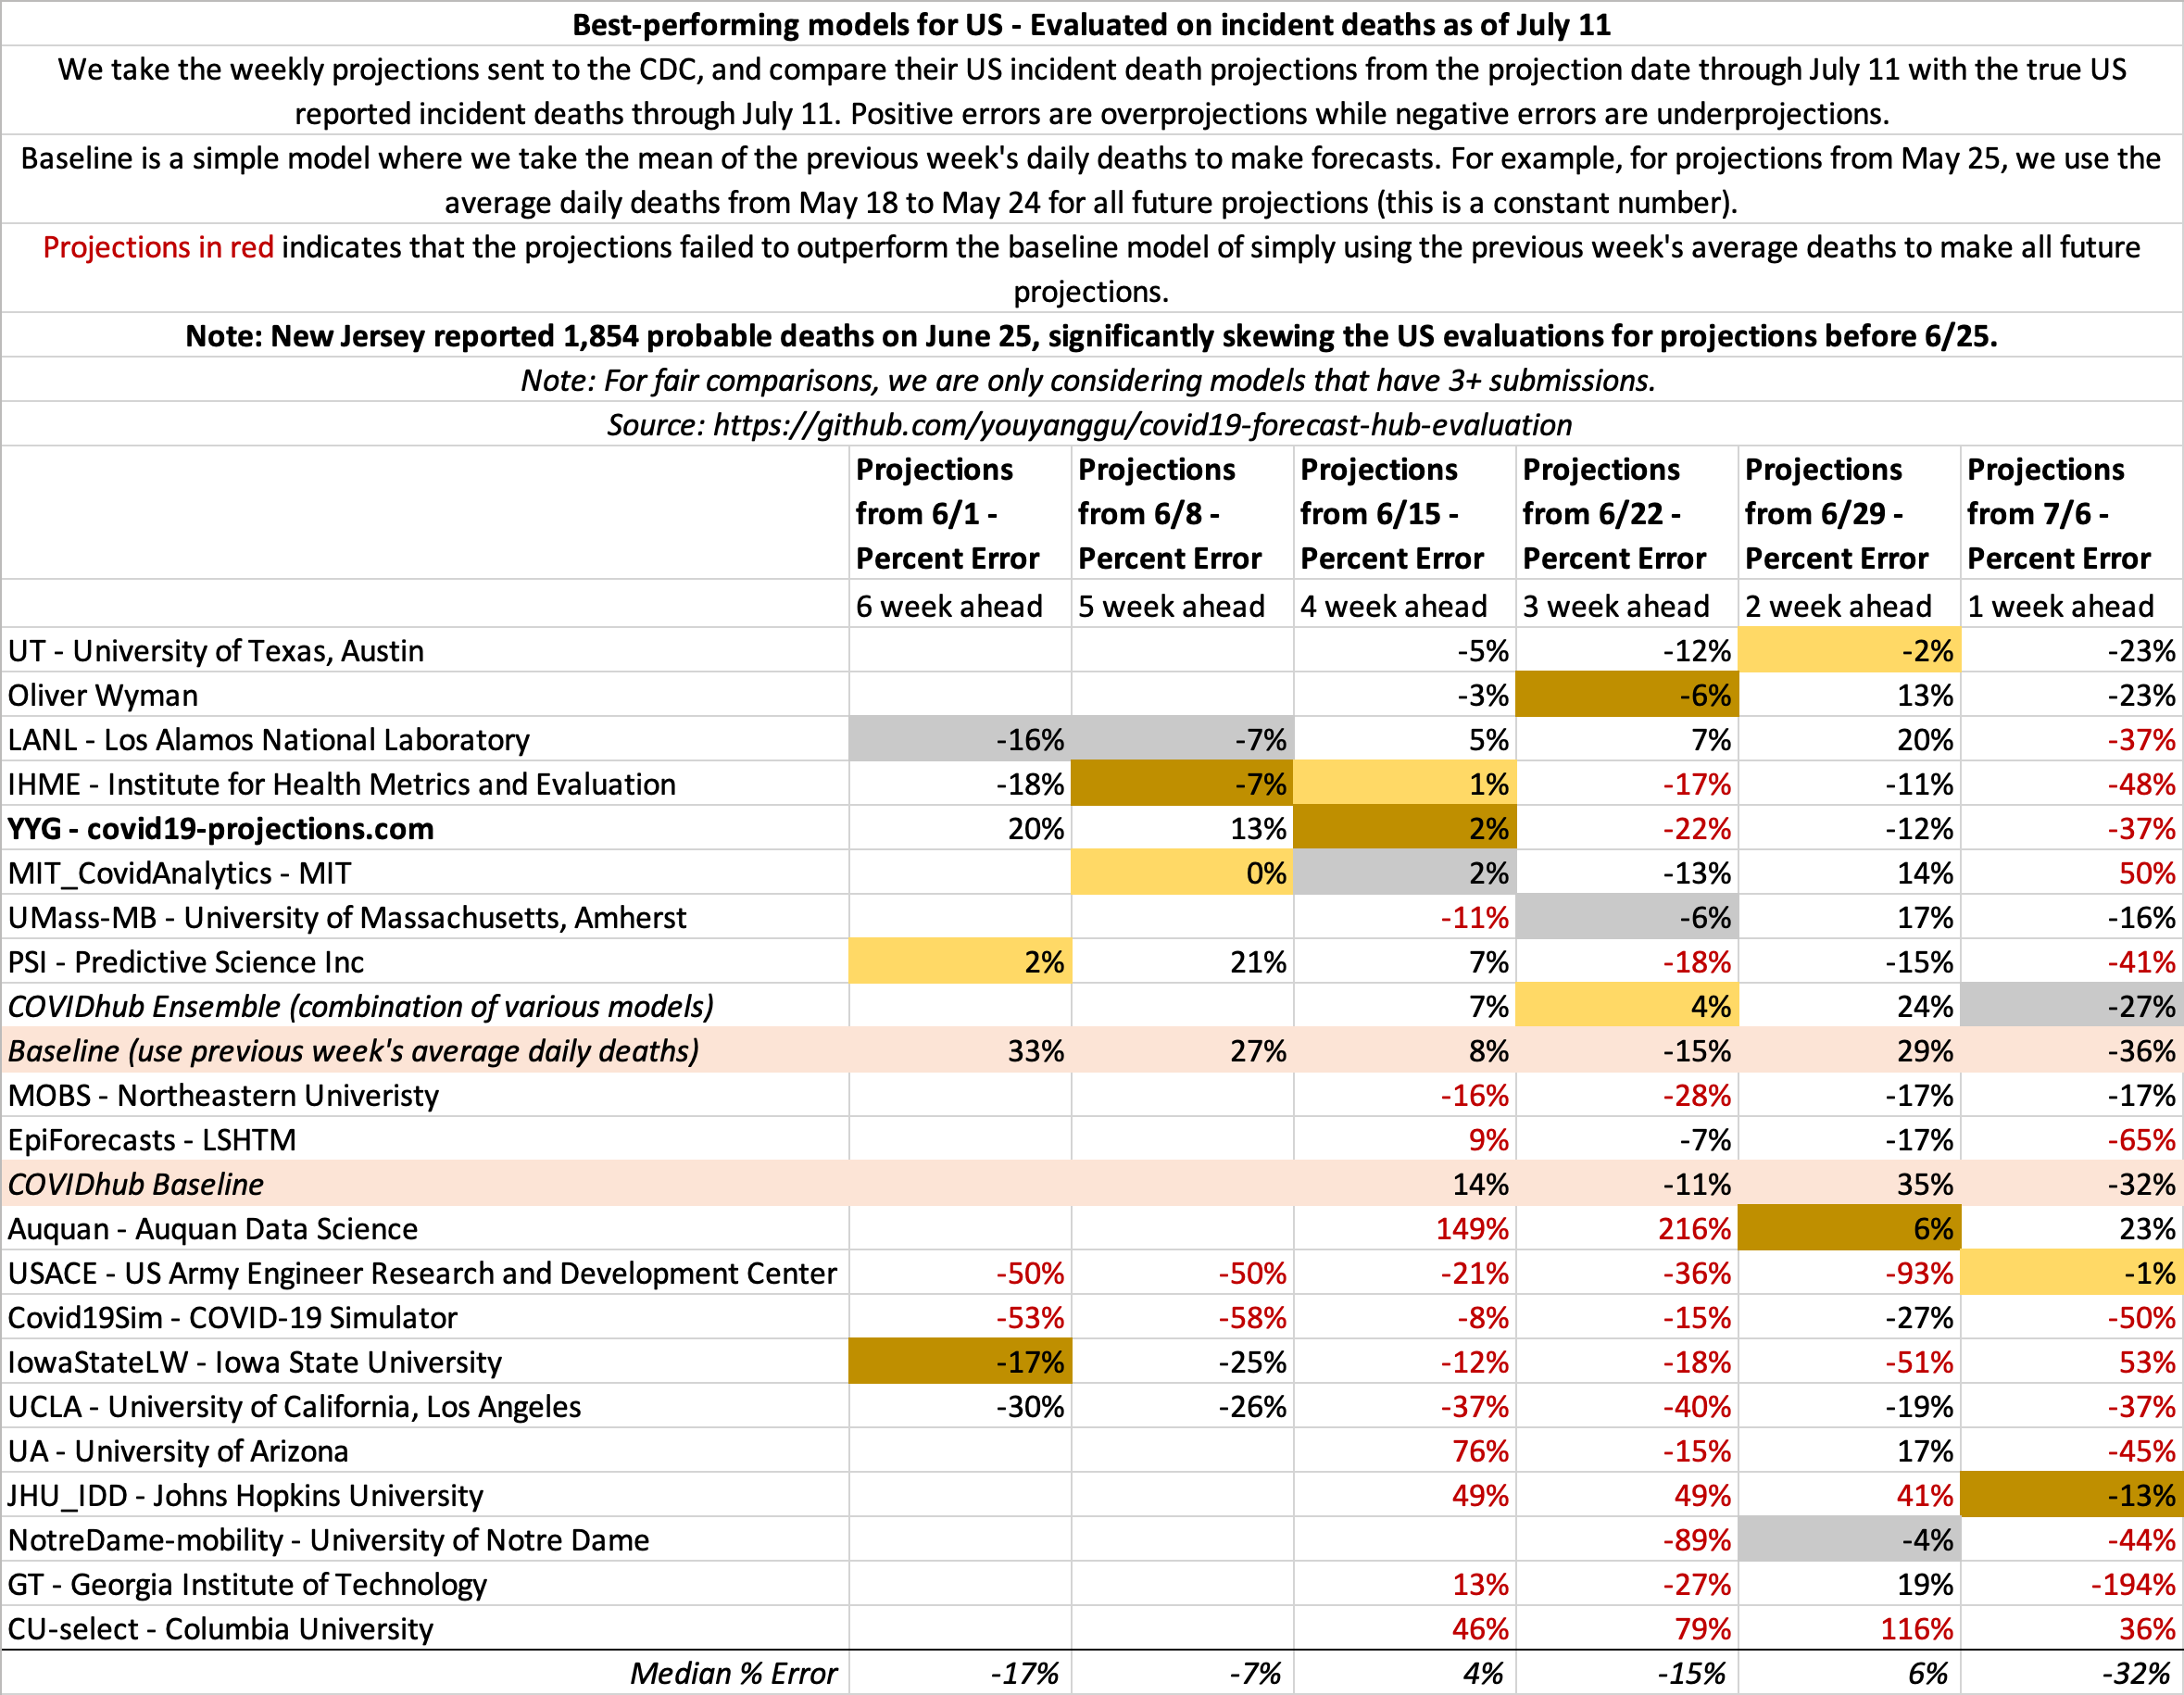
- July 11
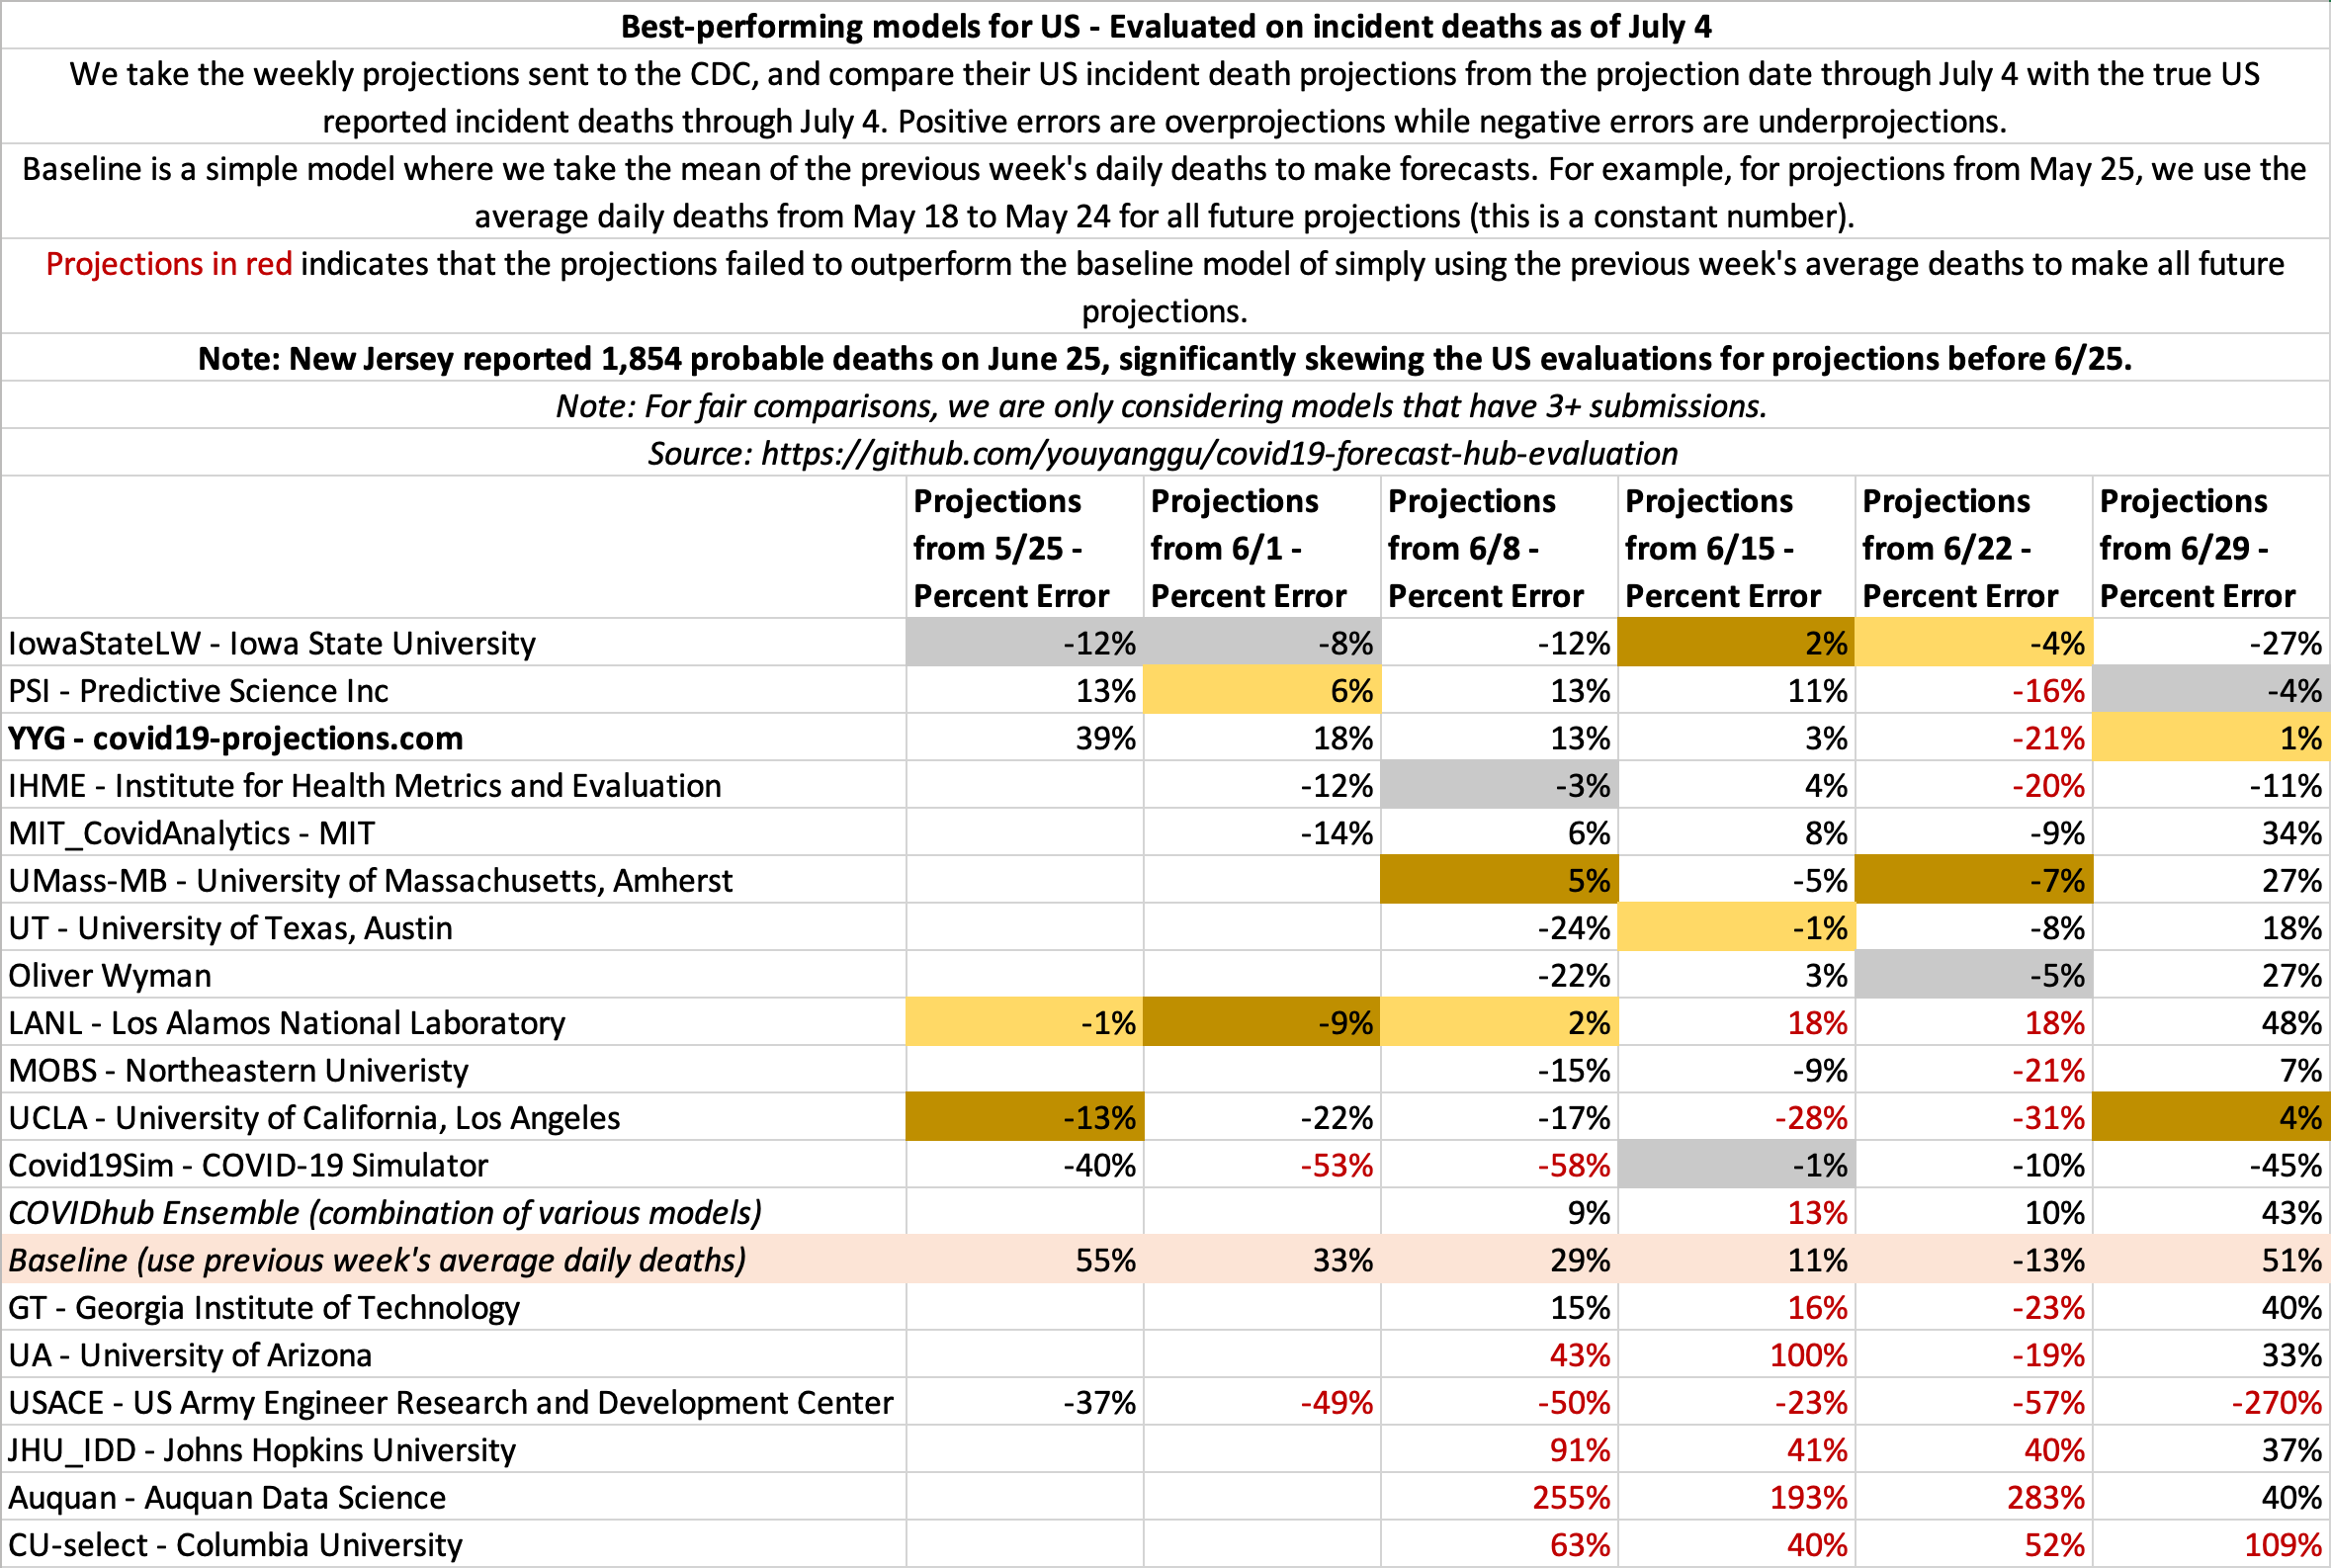
- July 4
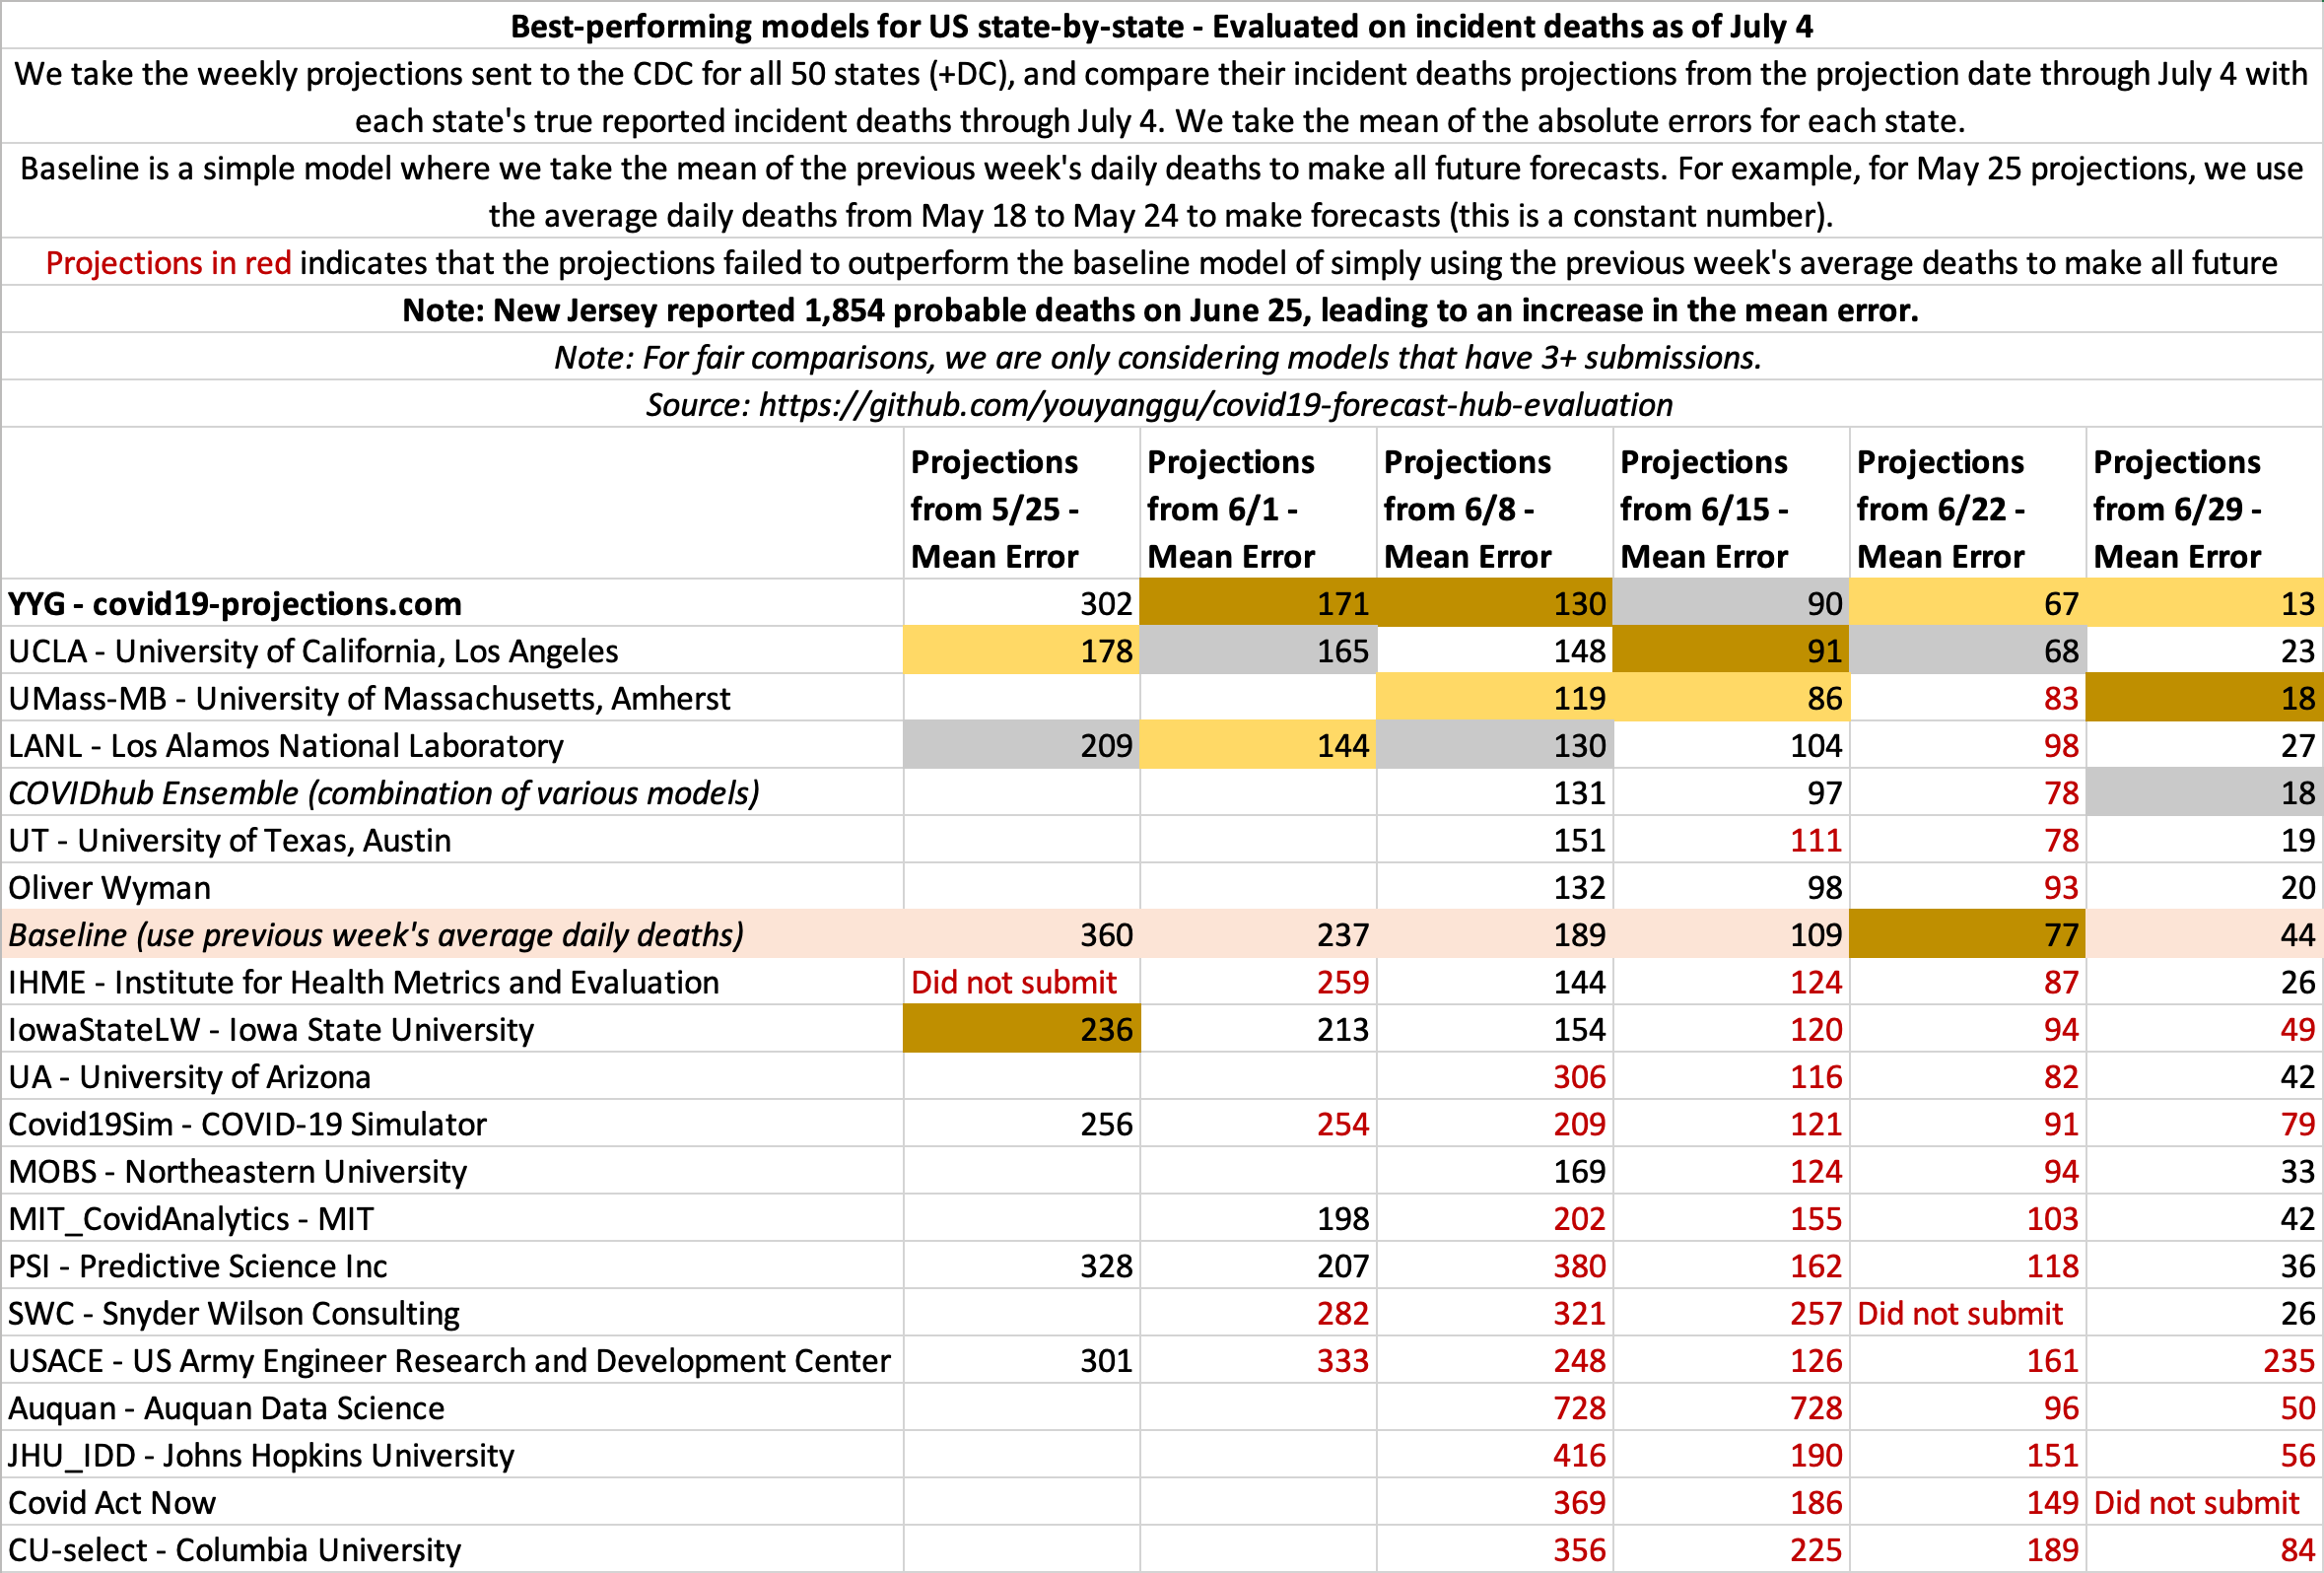
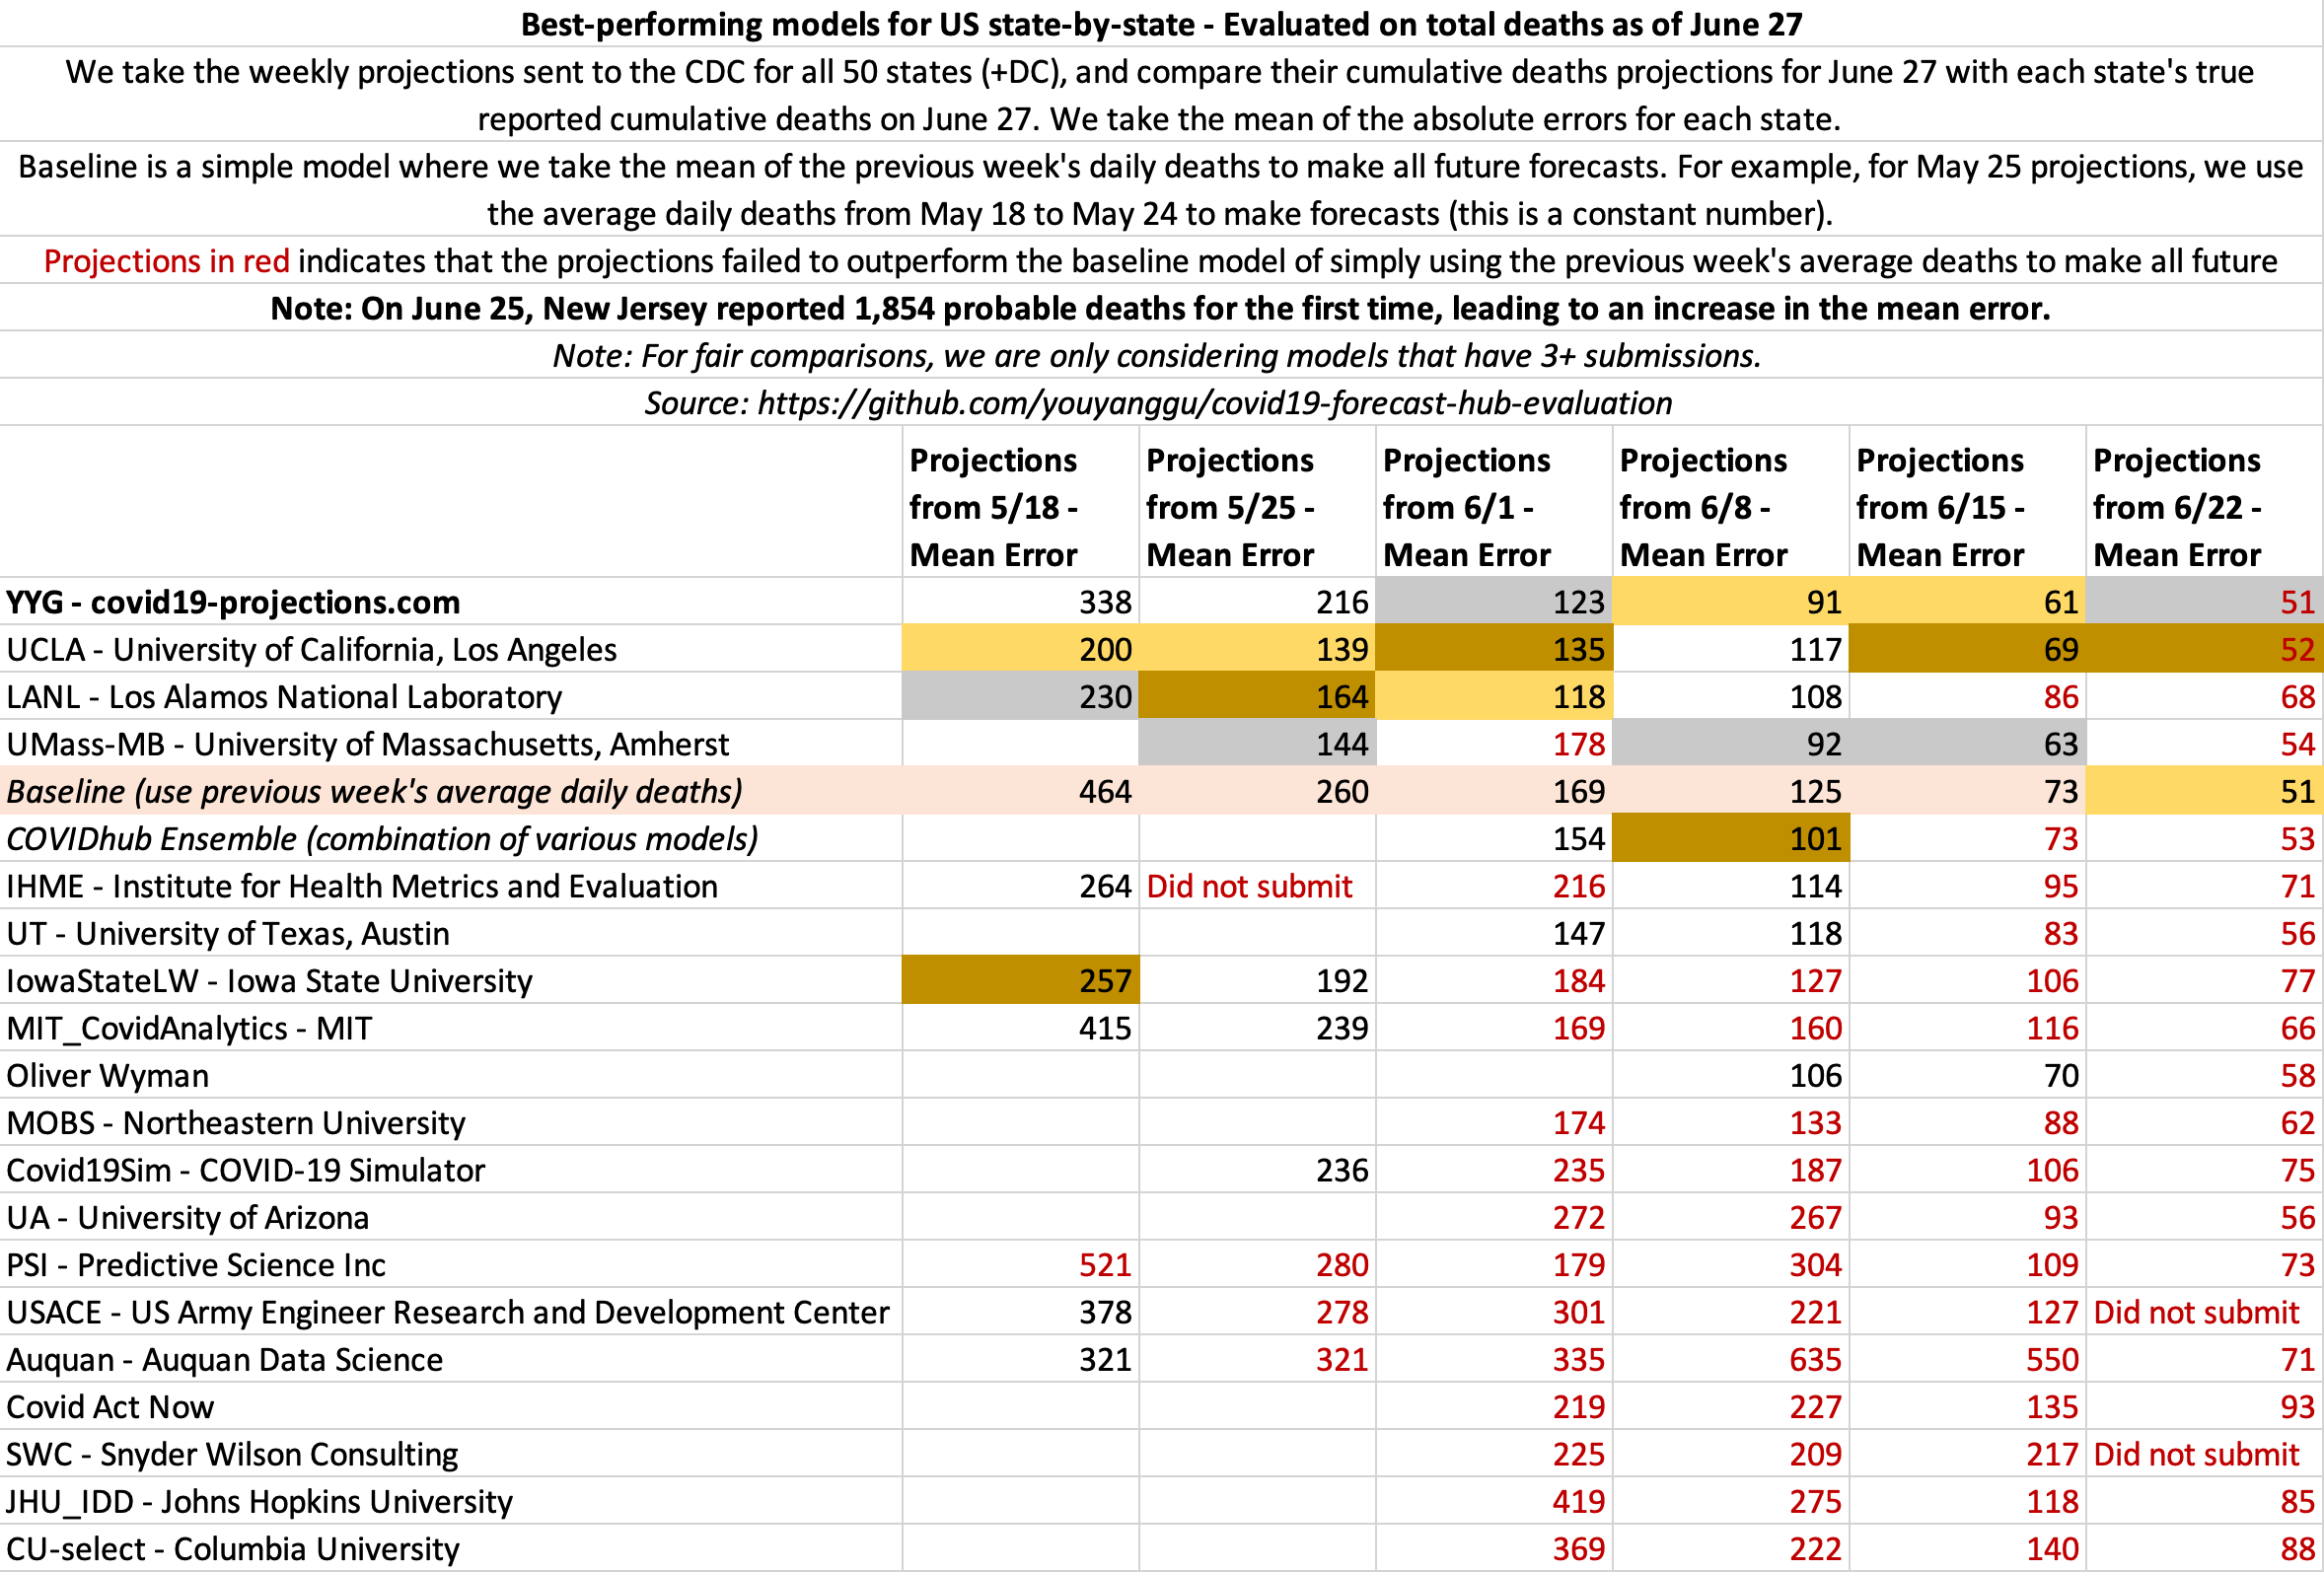
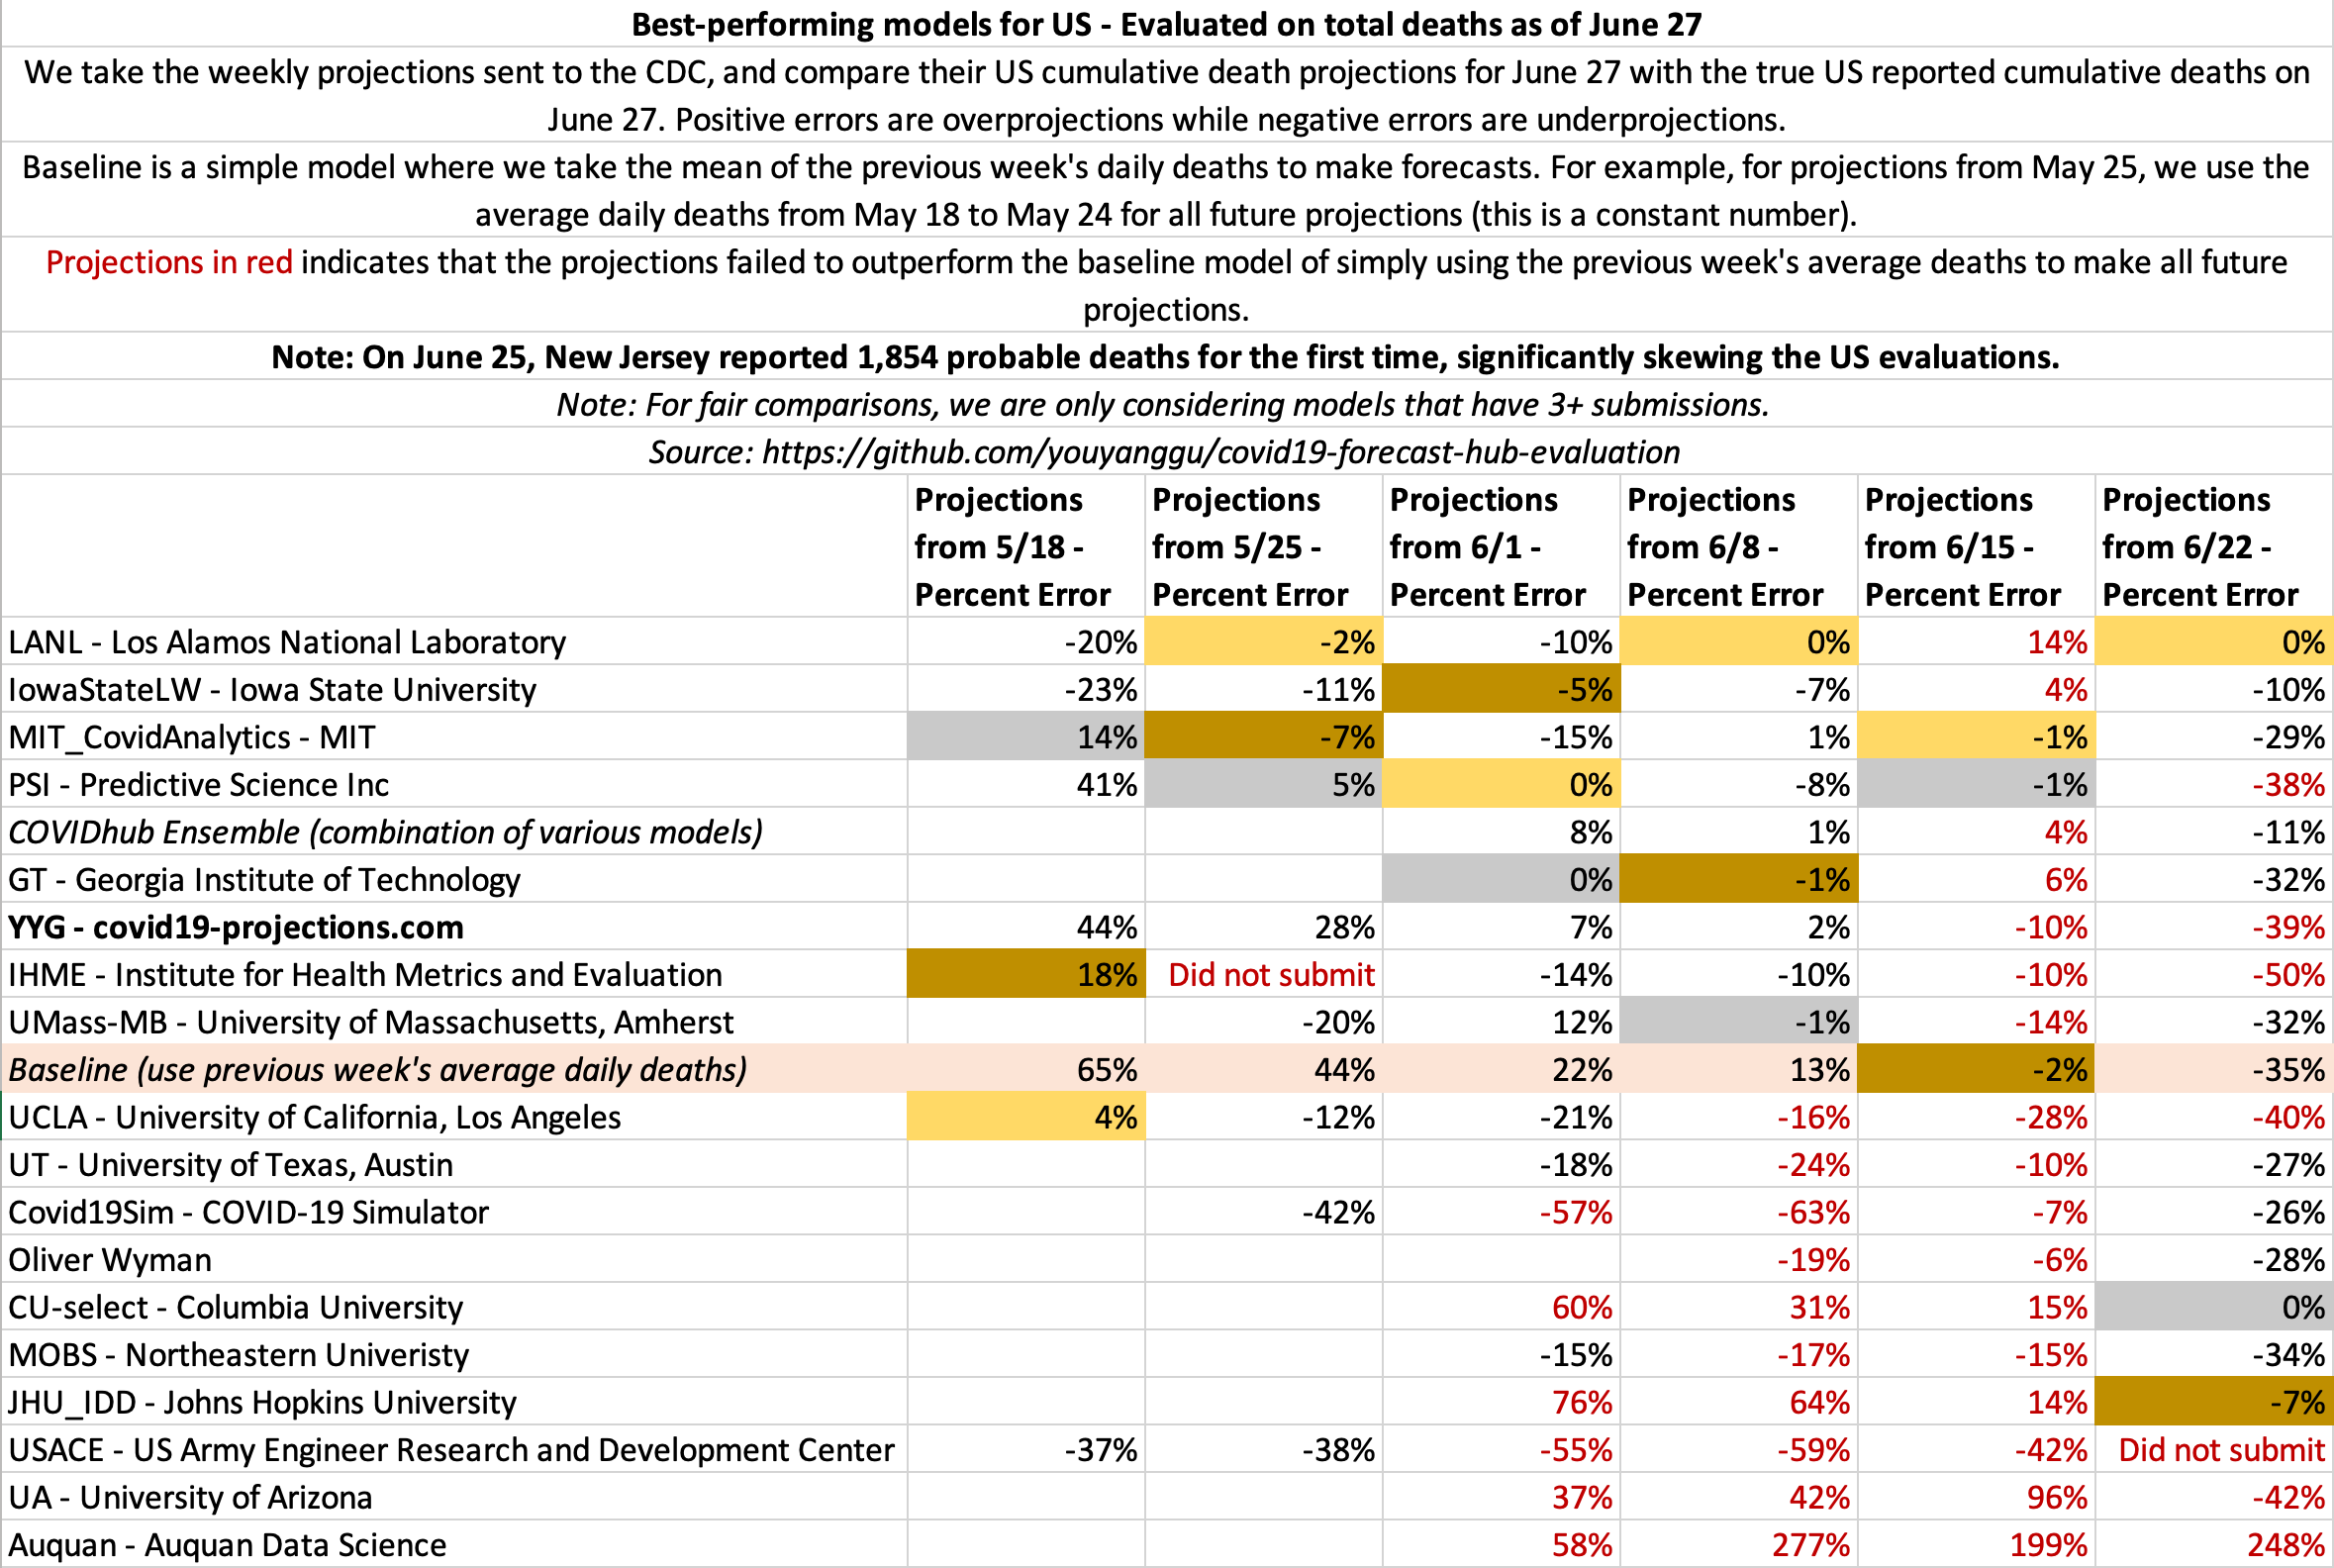
- June 27
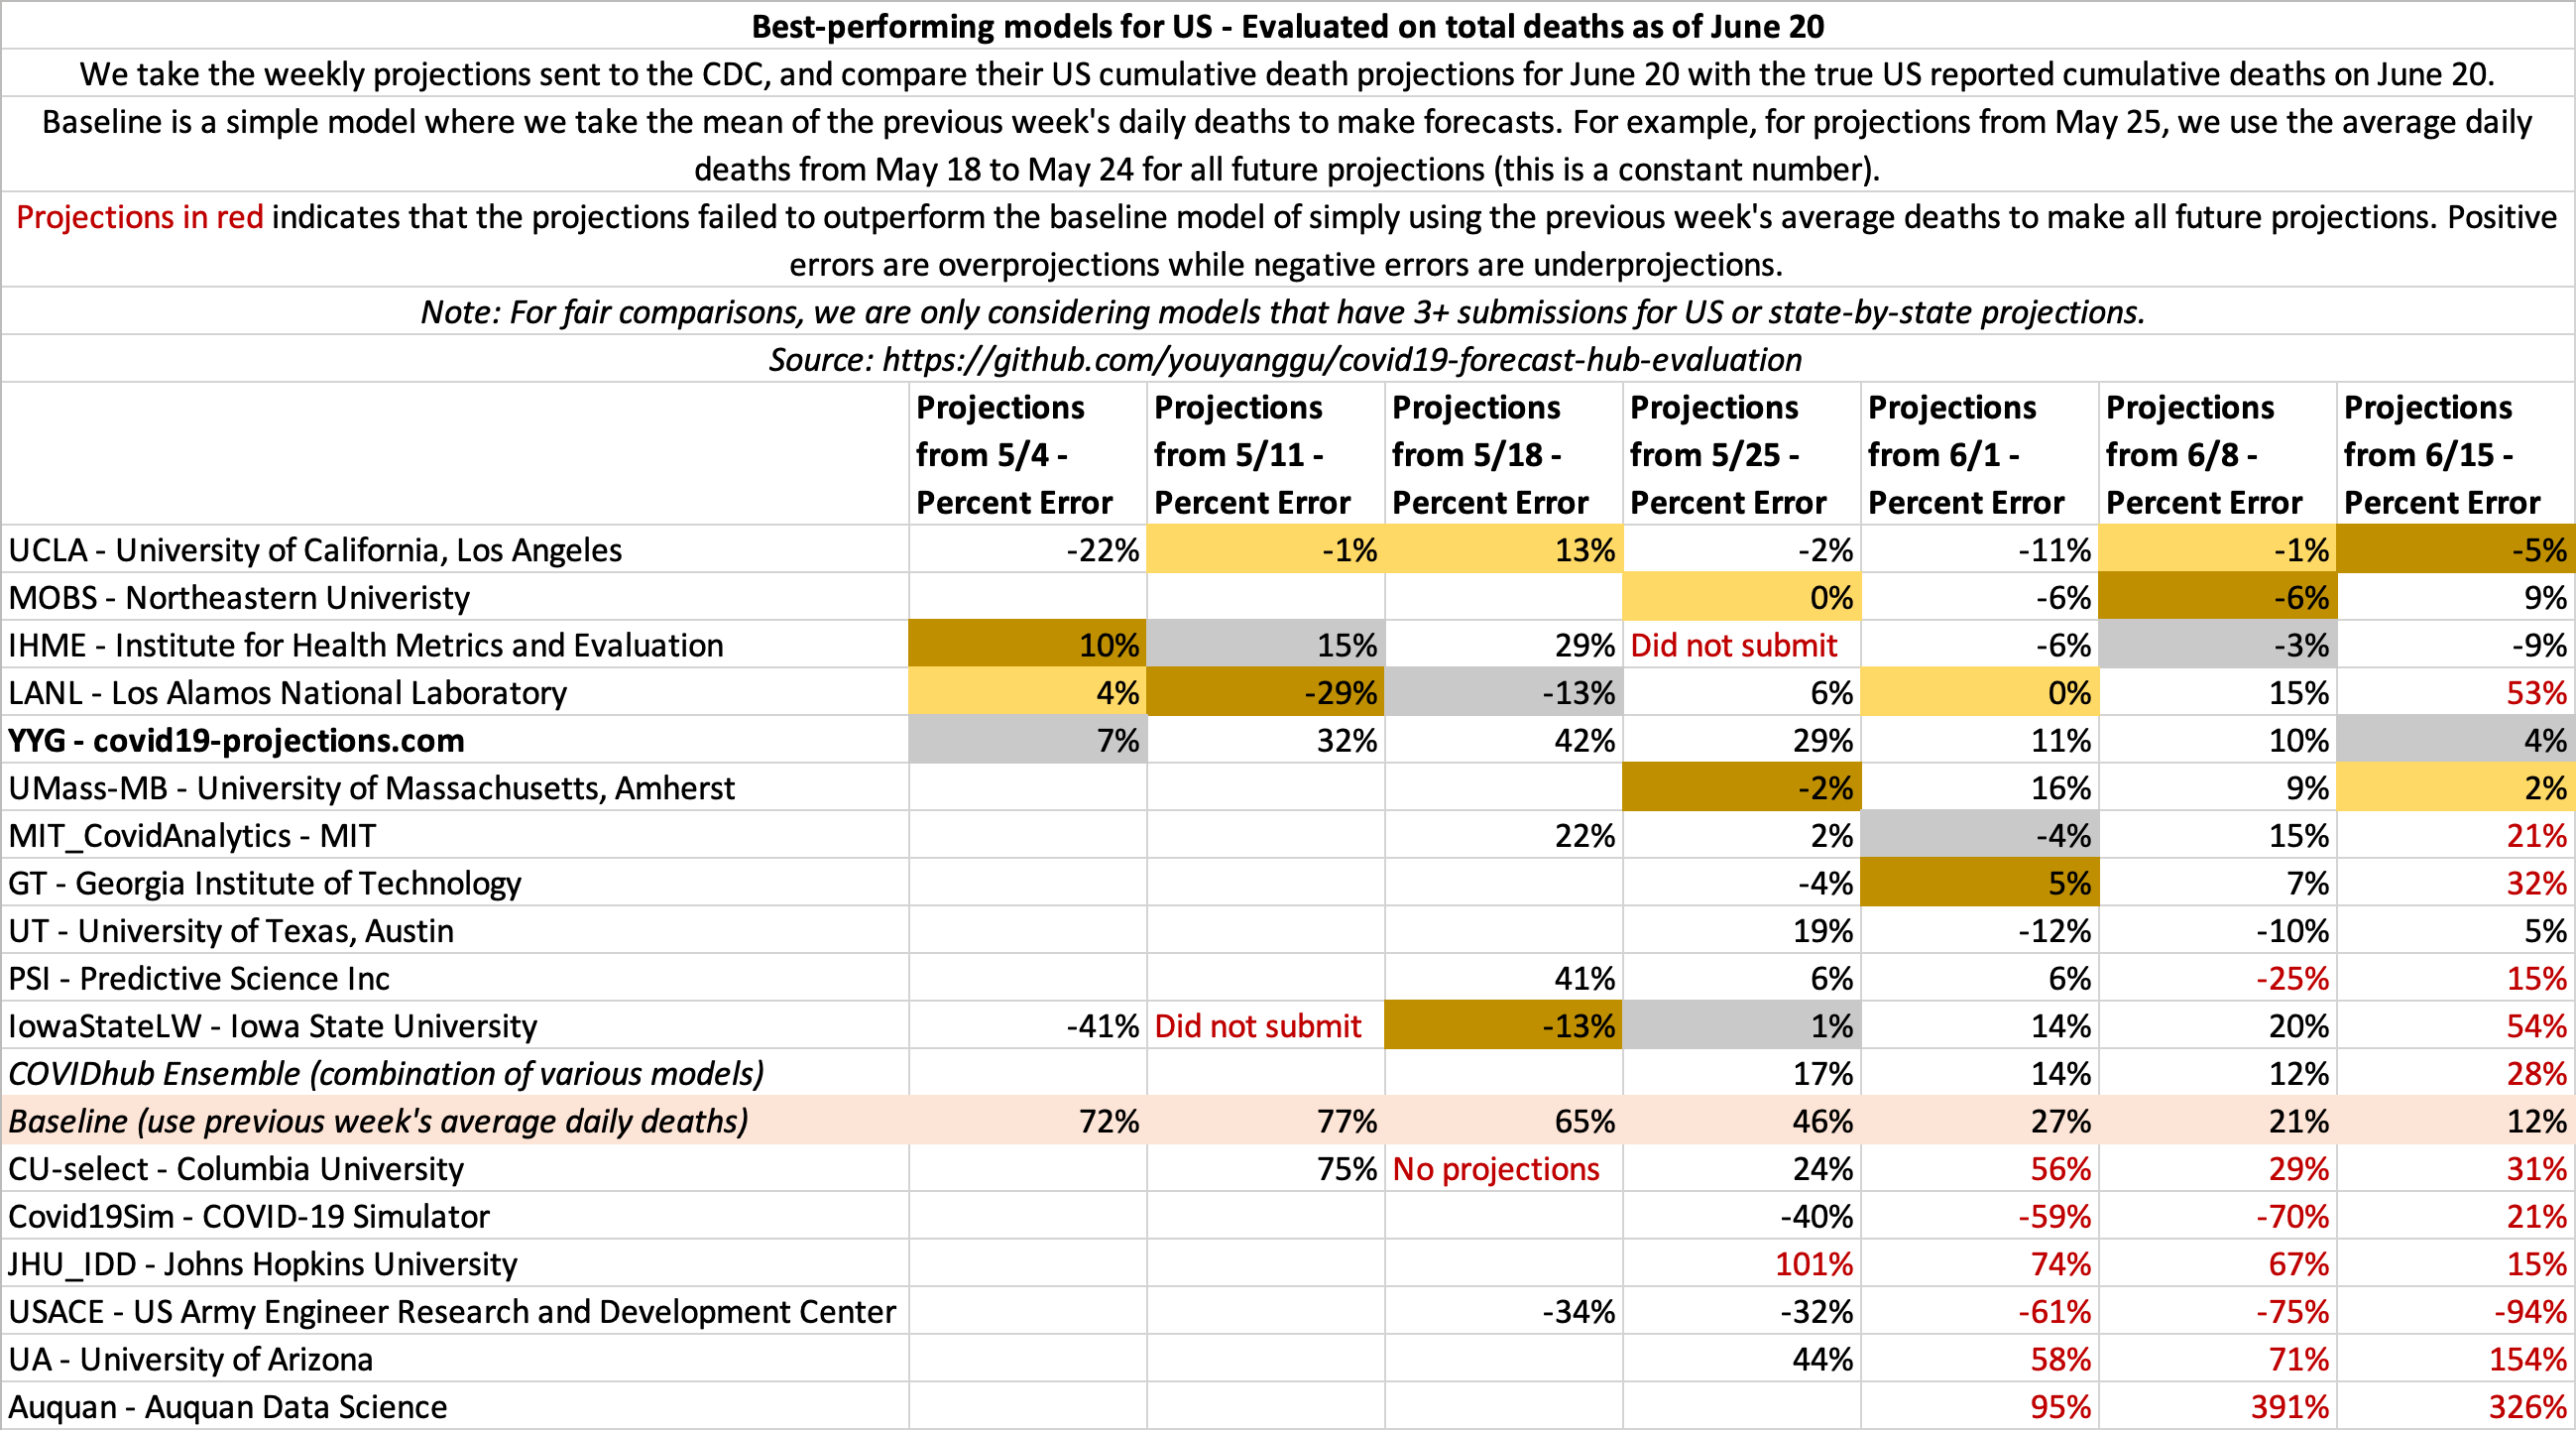
- June 20
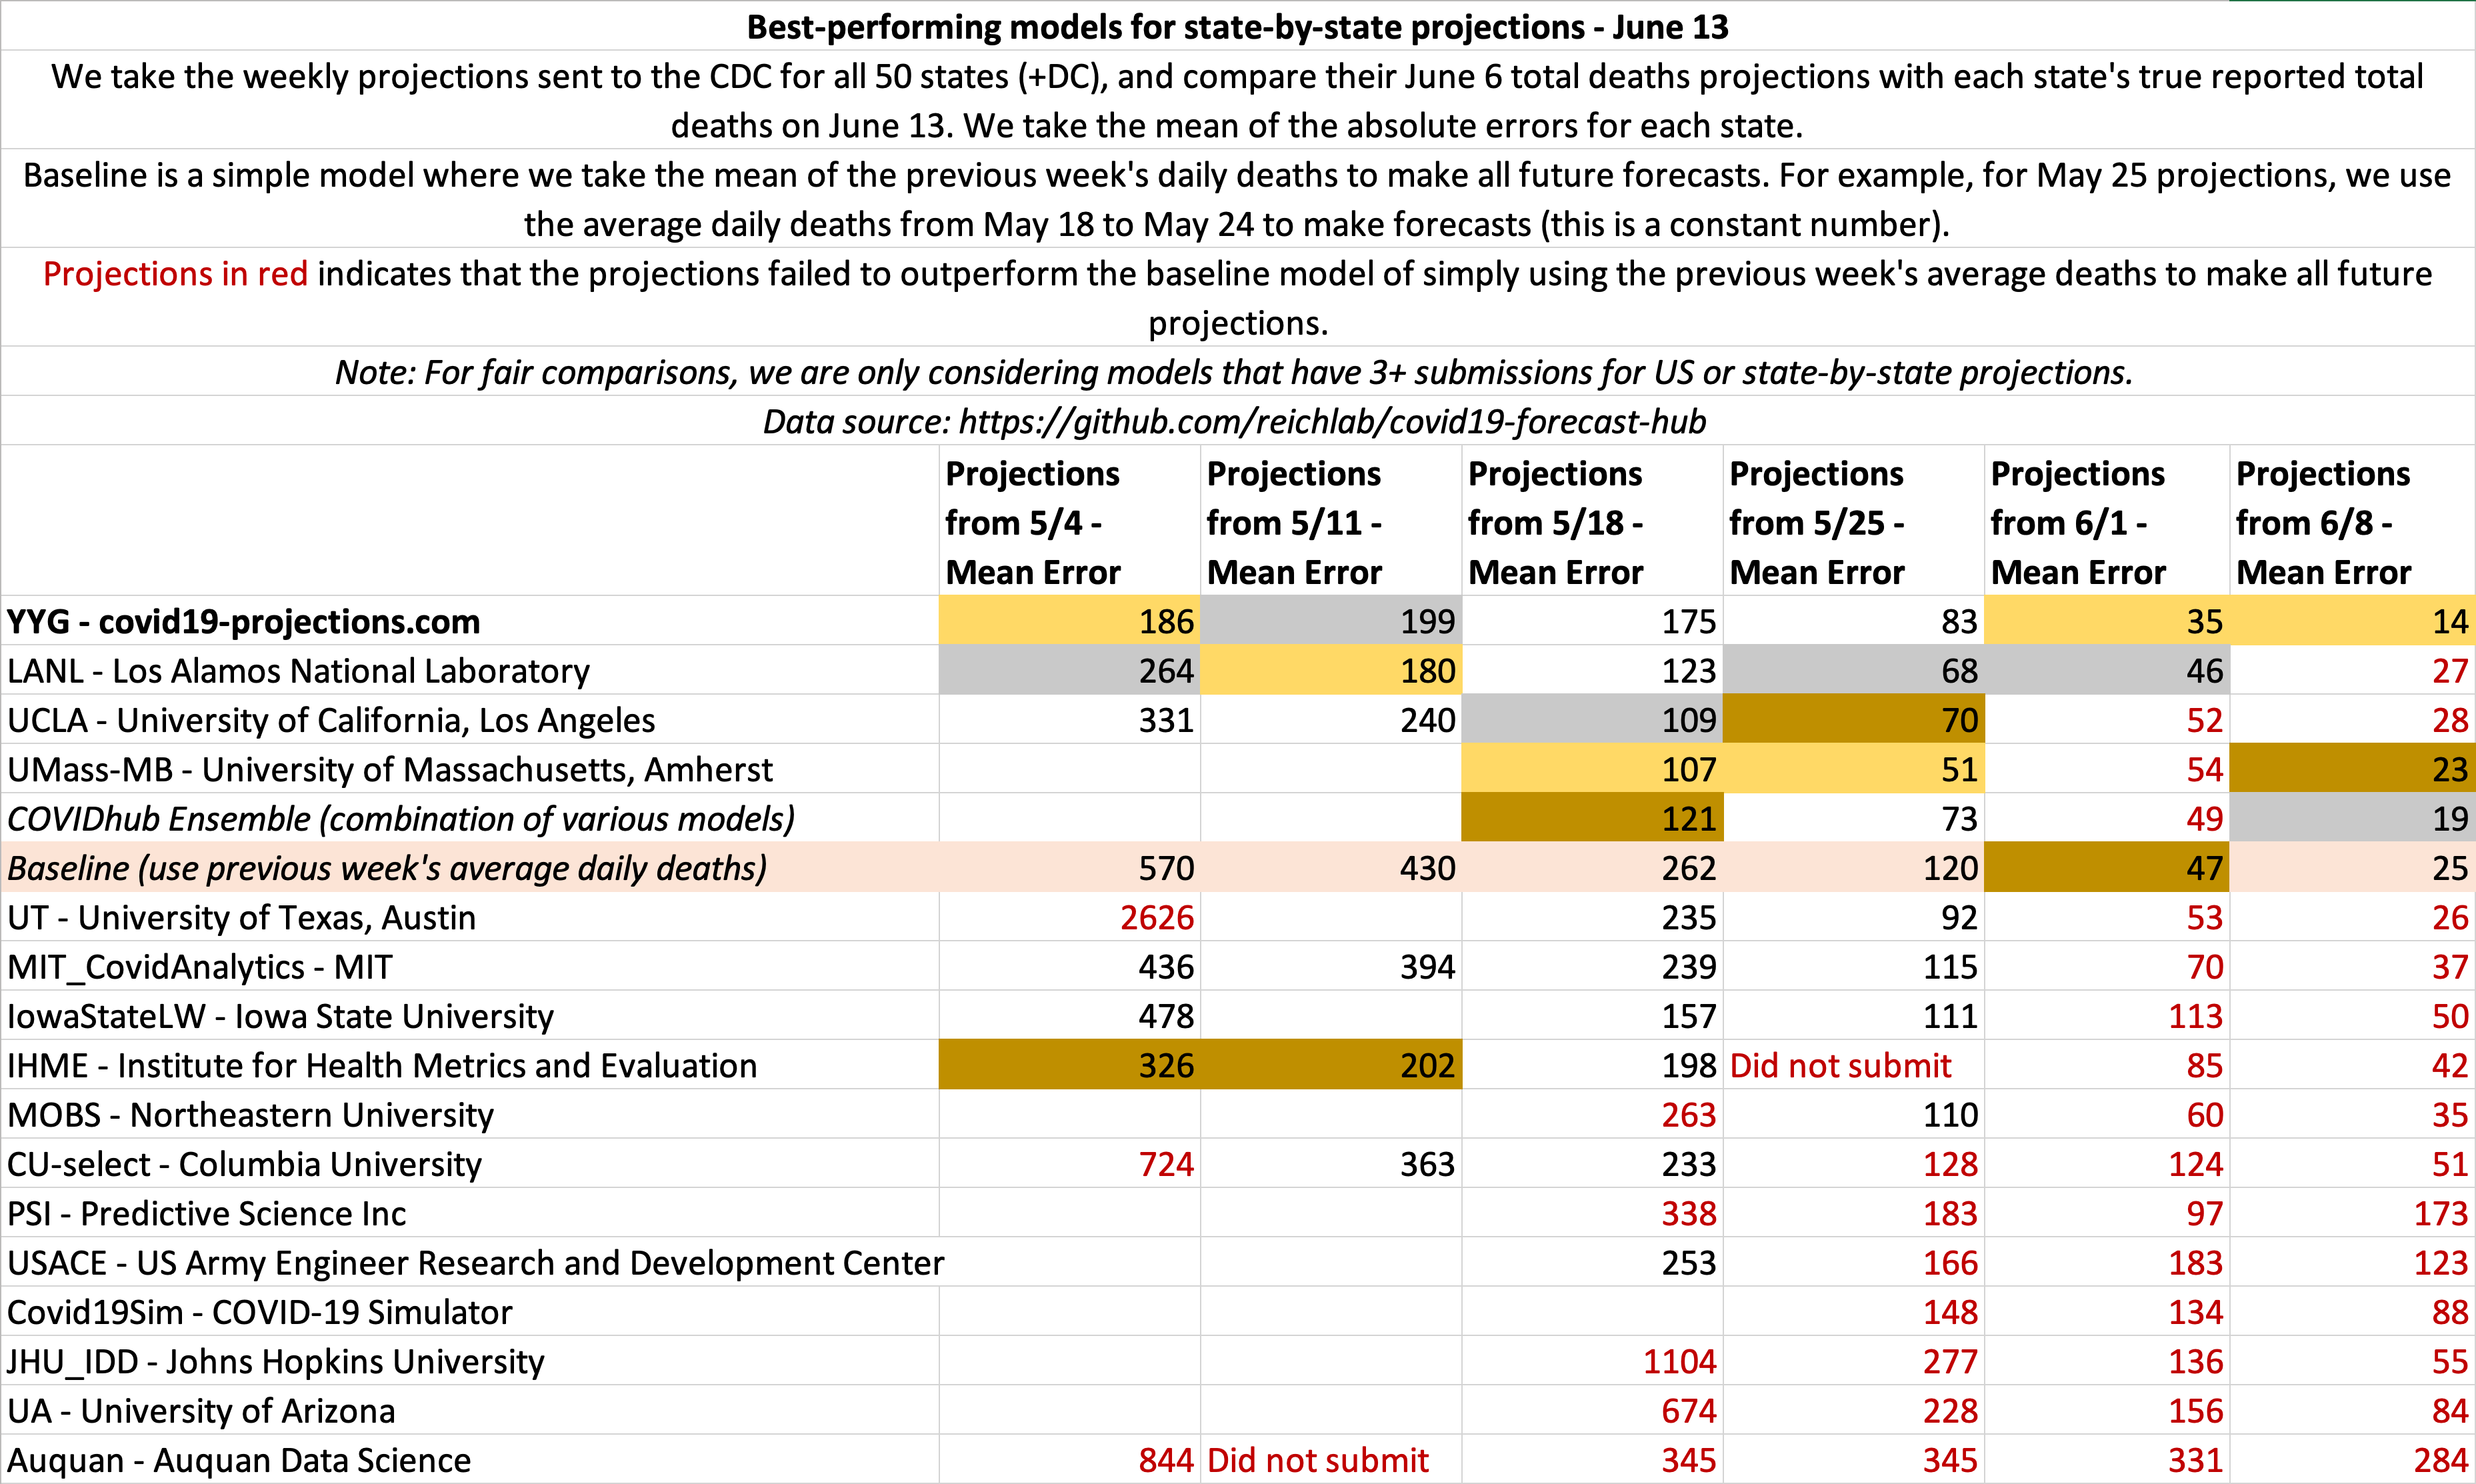
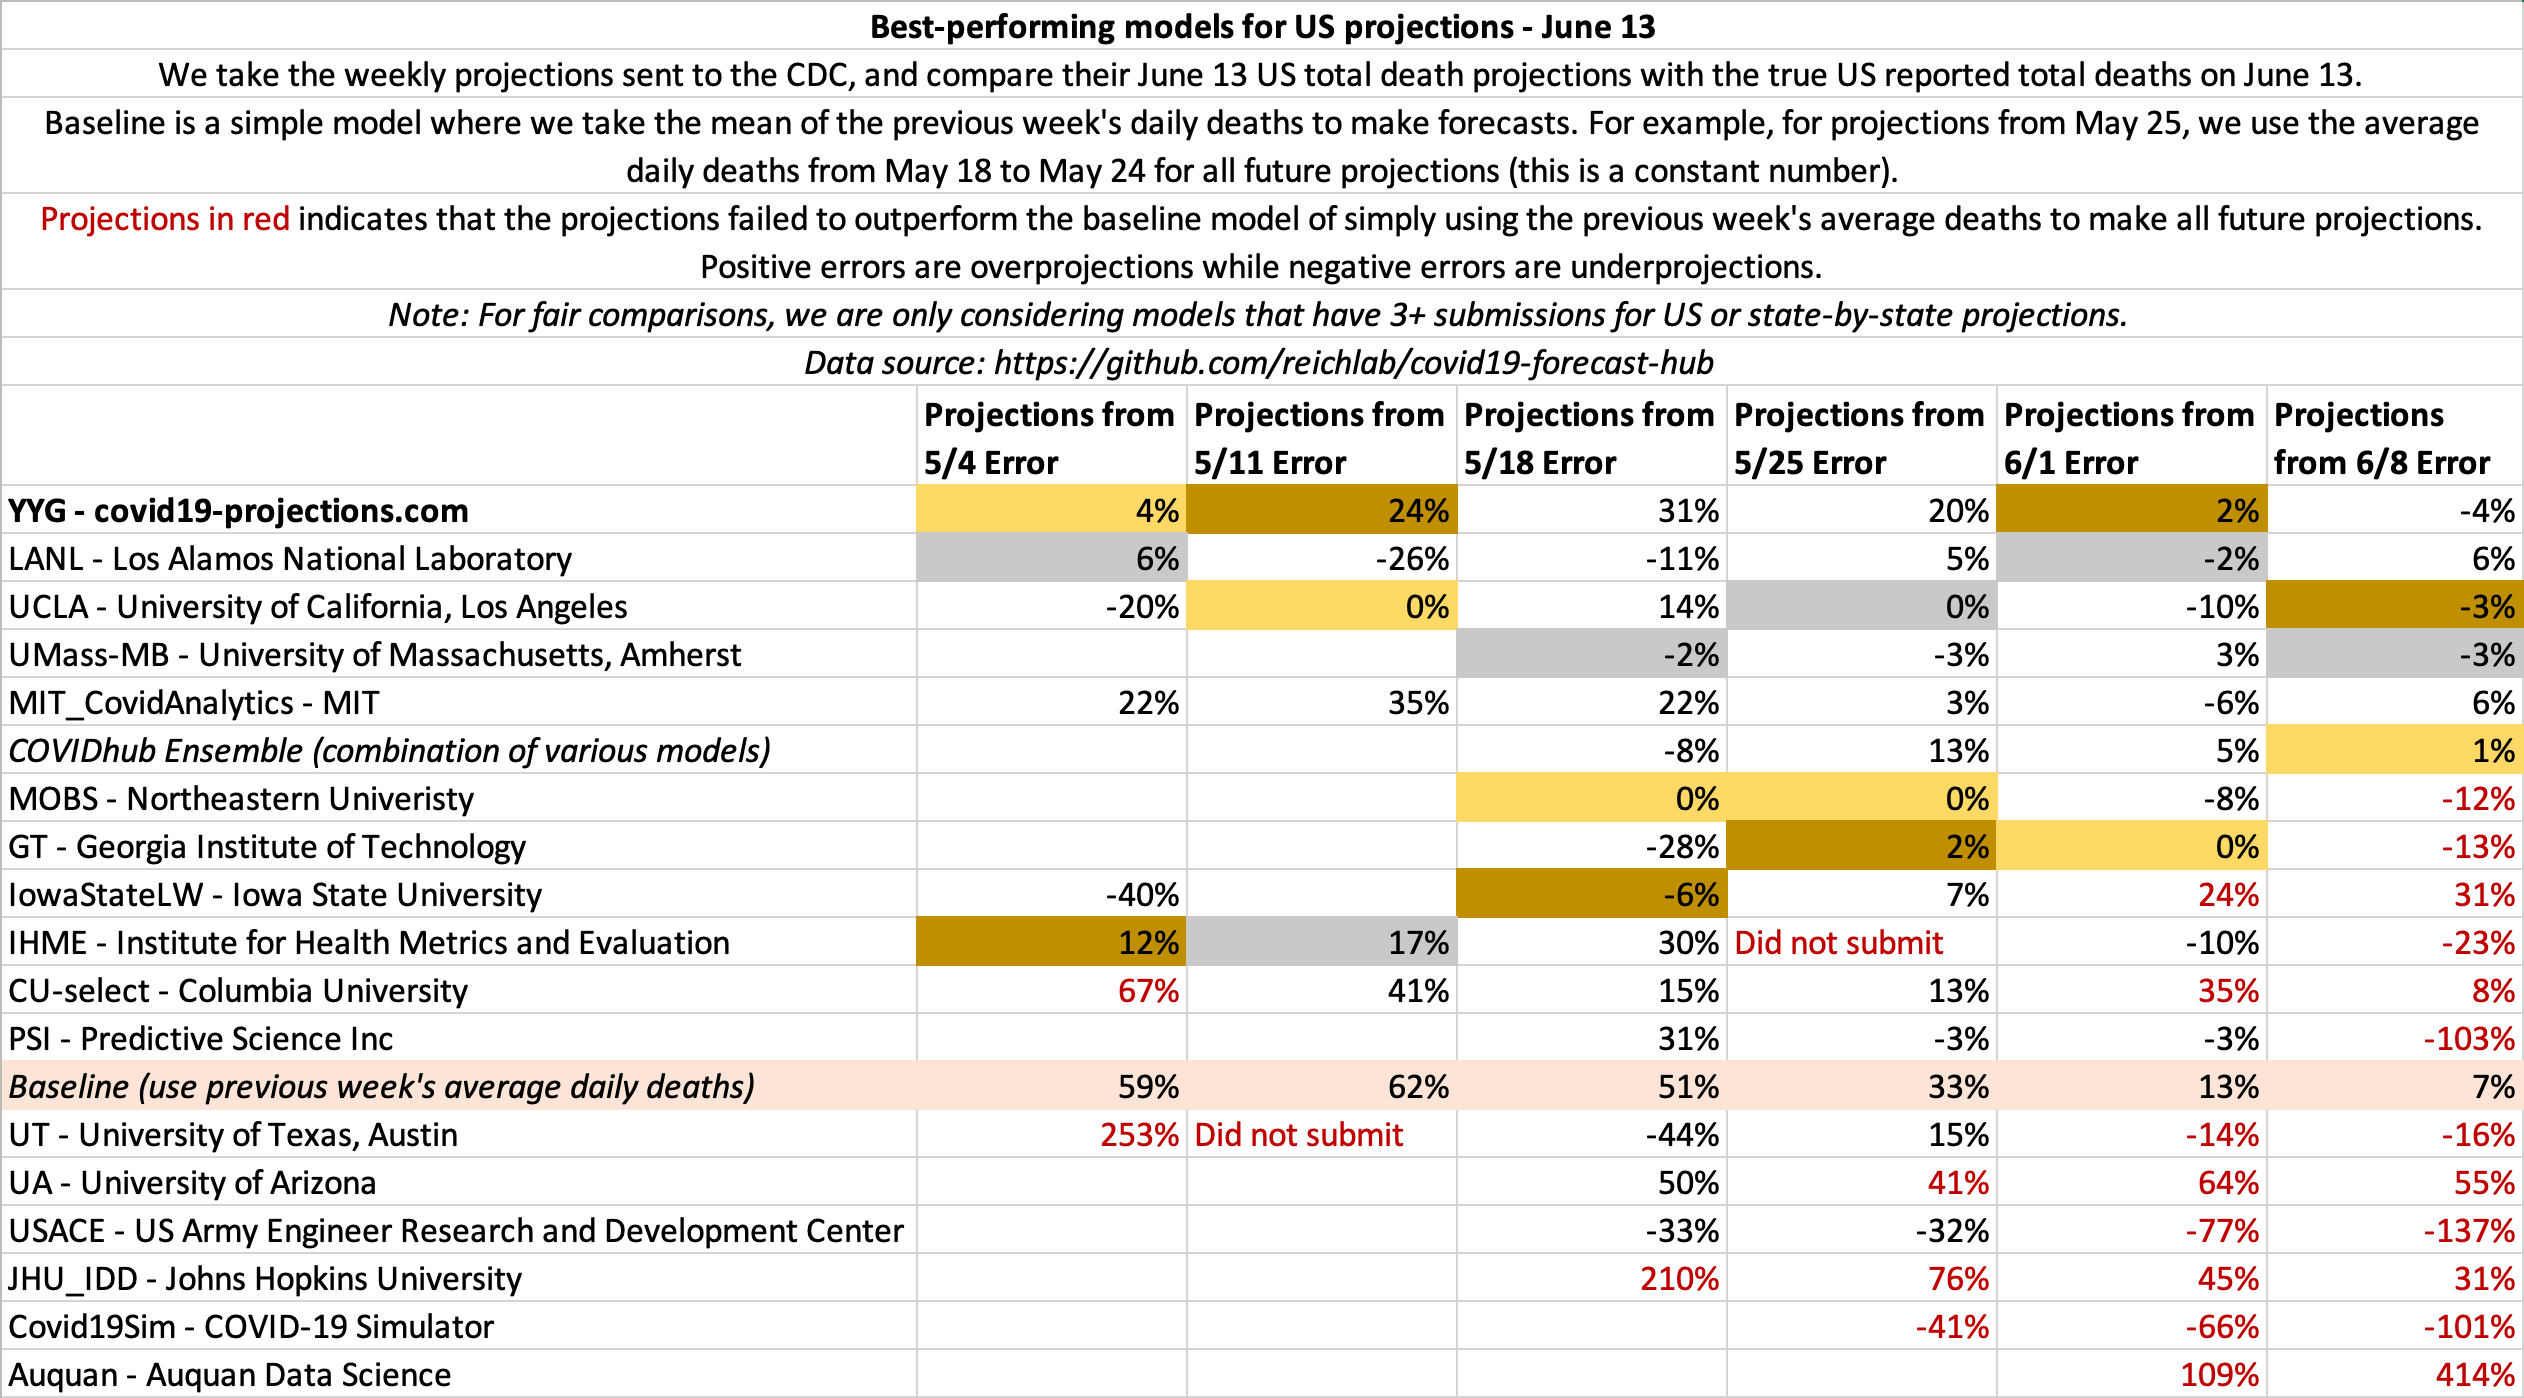
- June 13
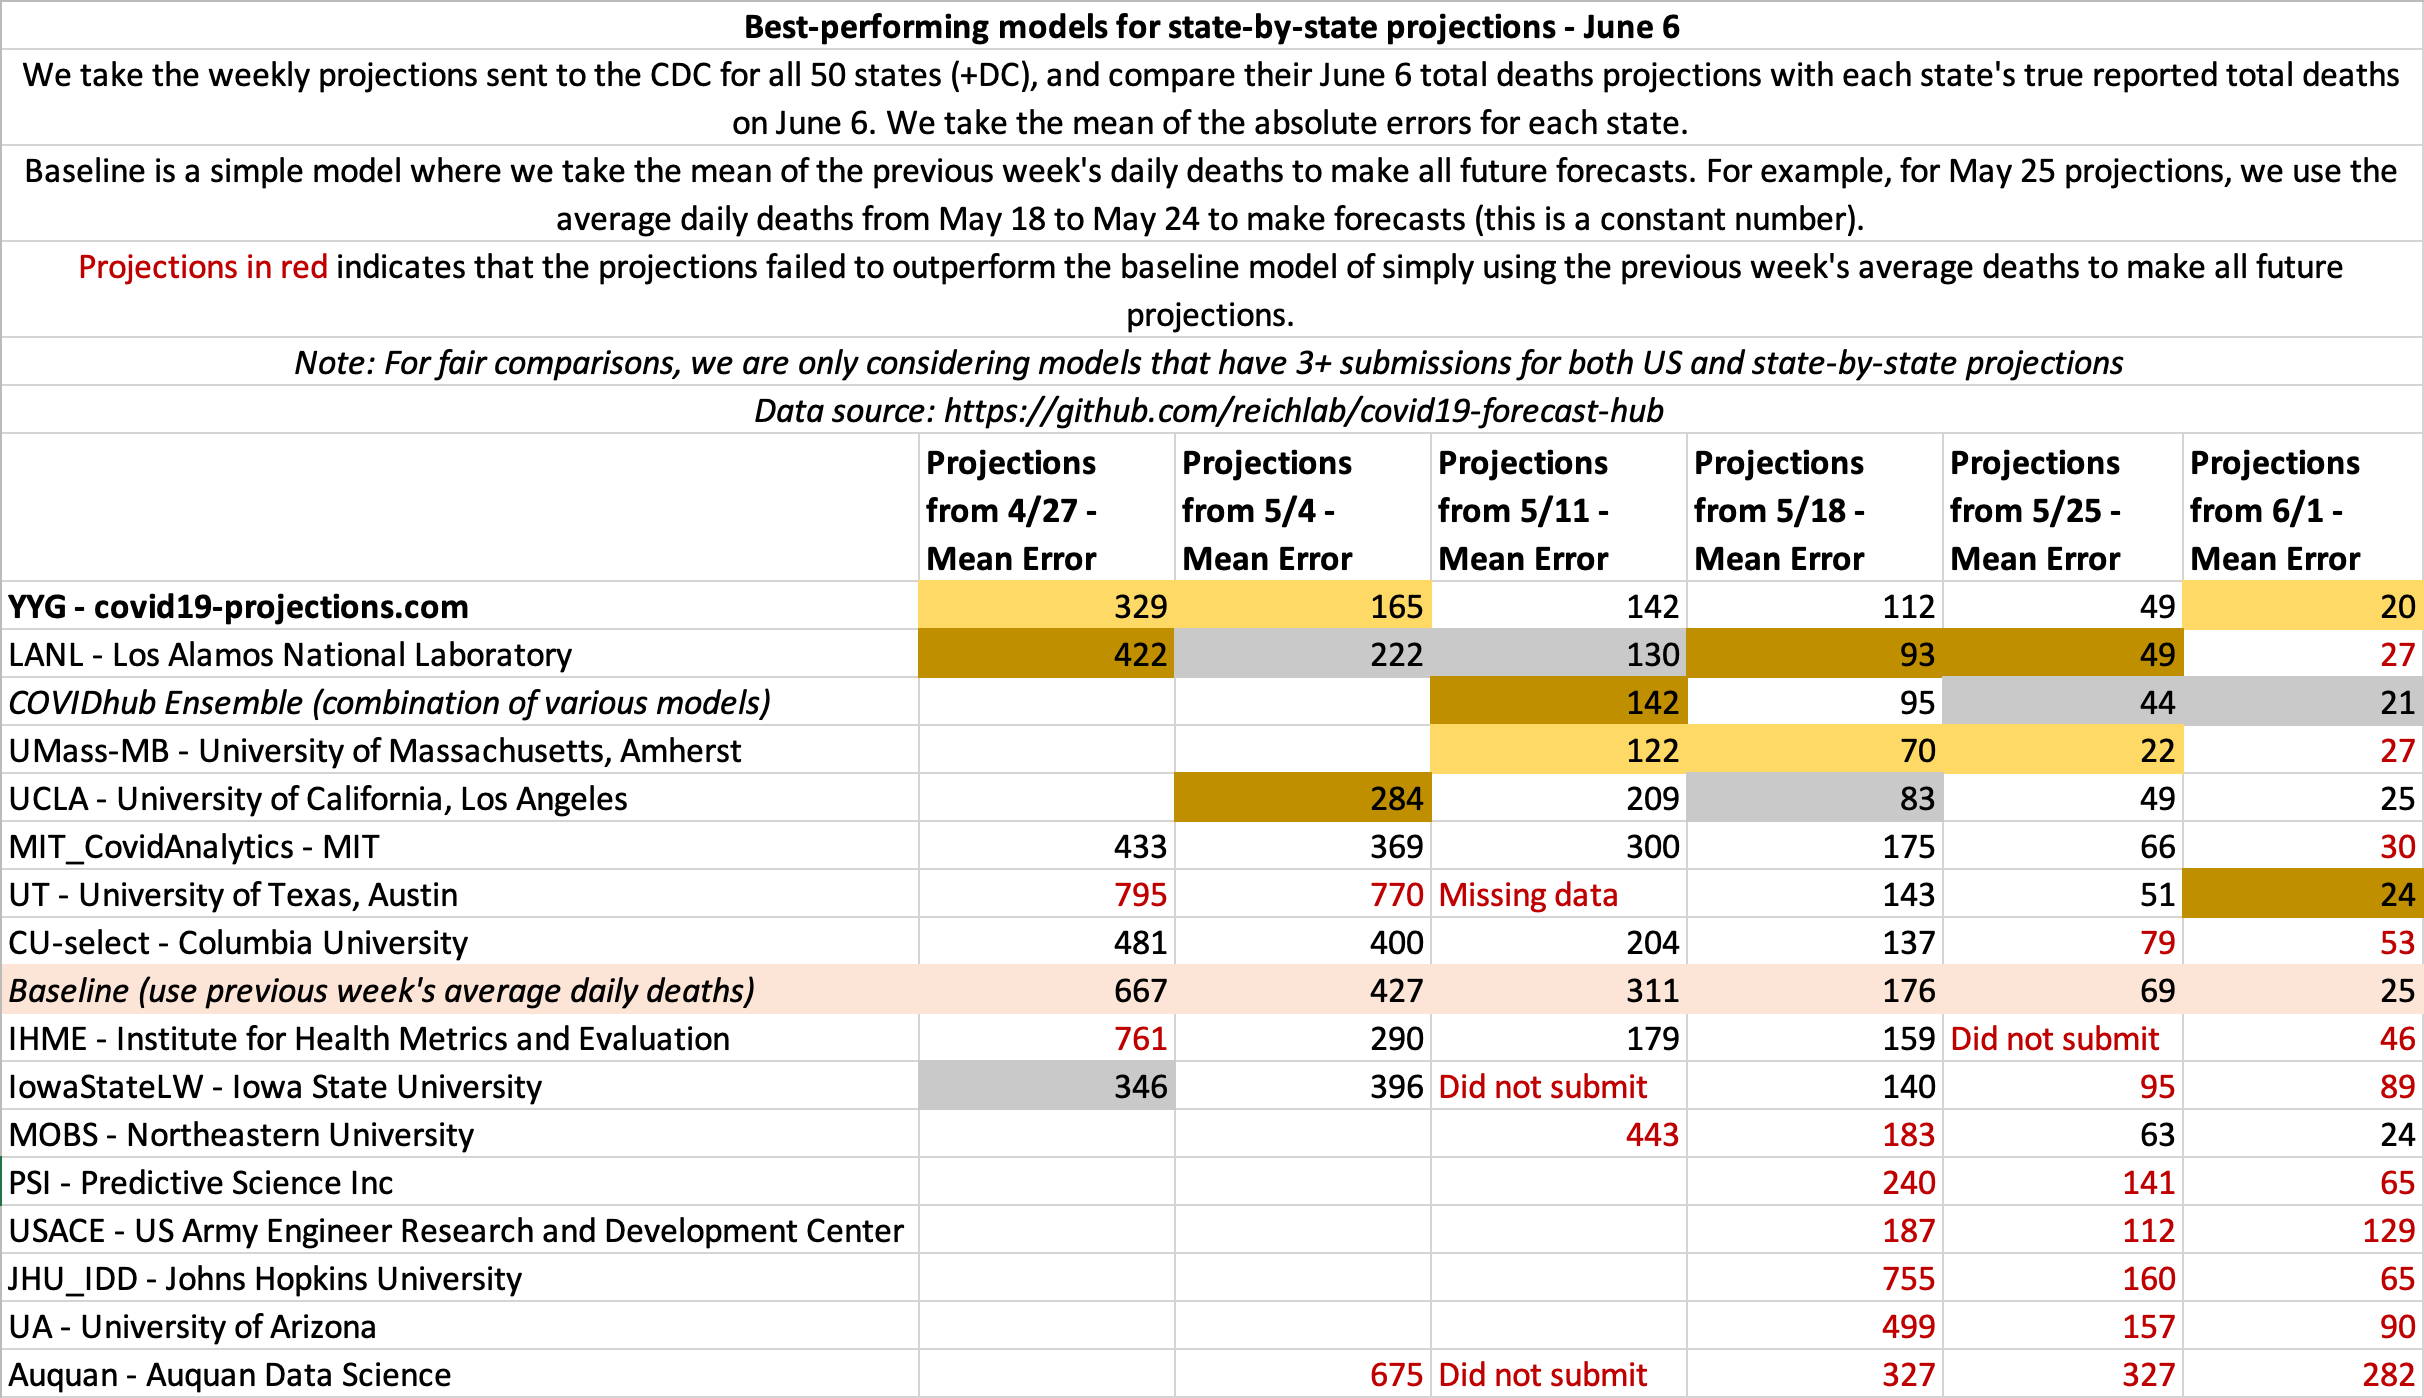
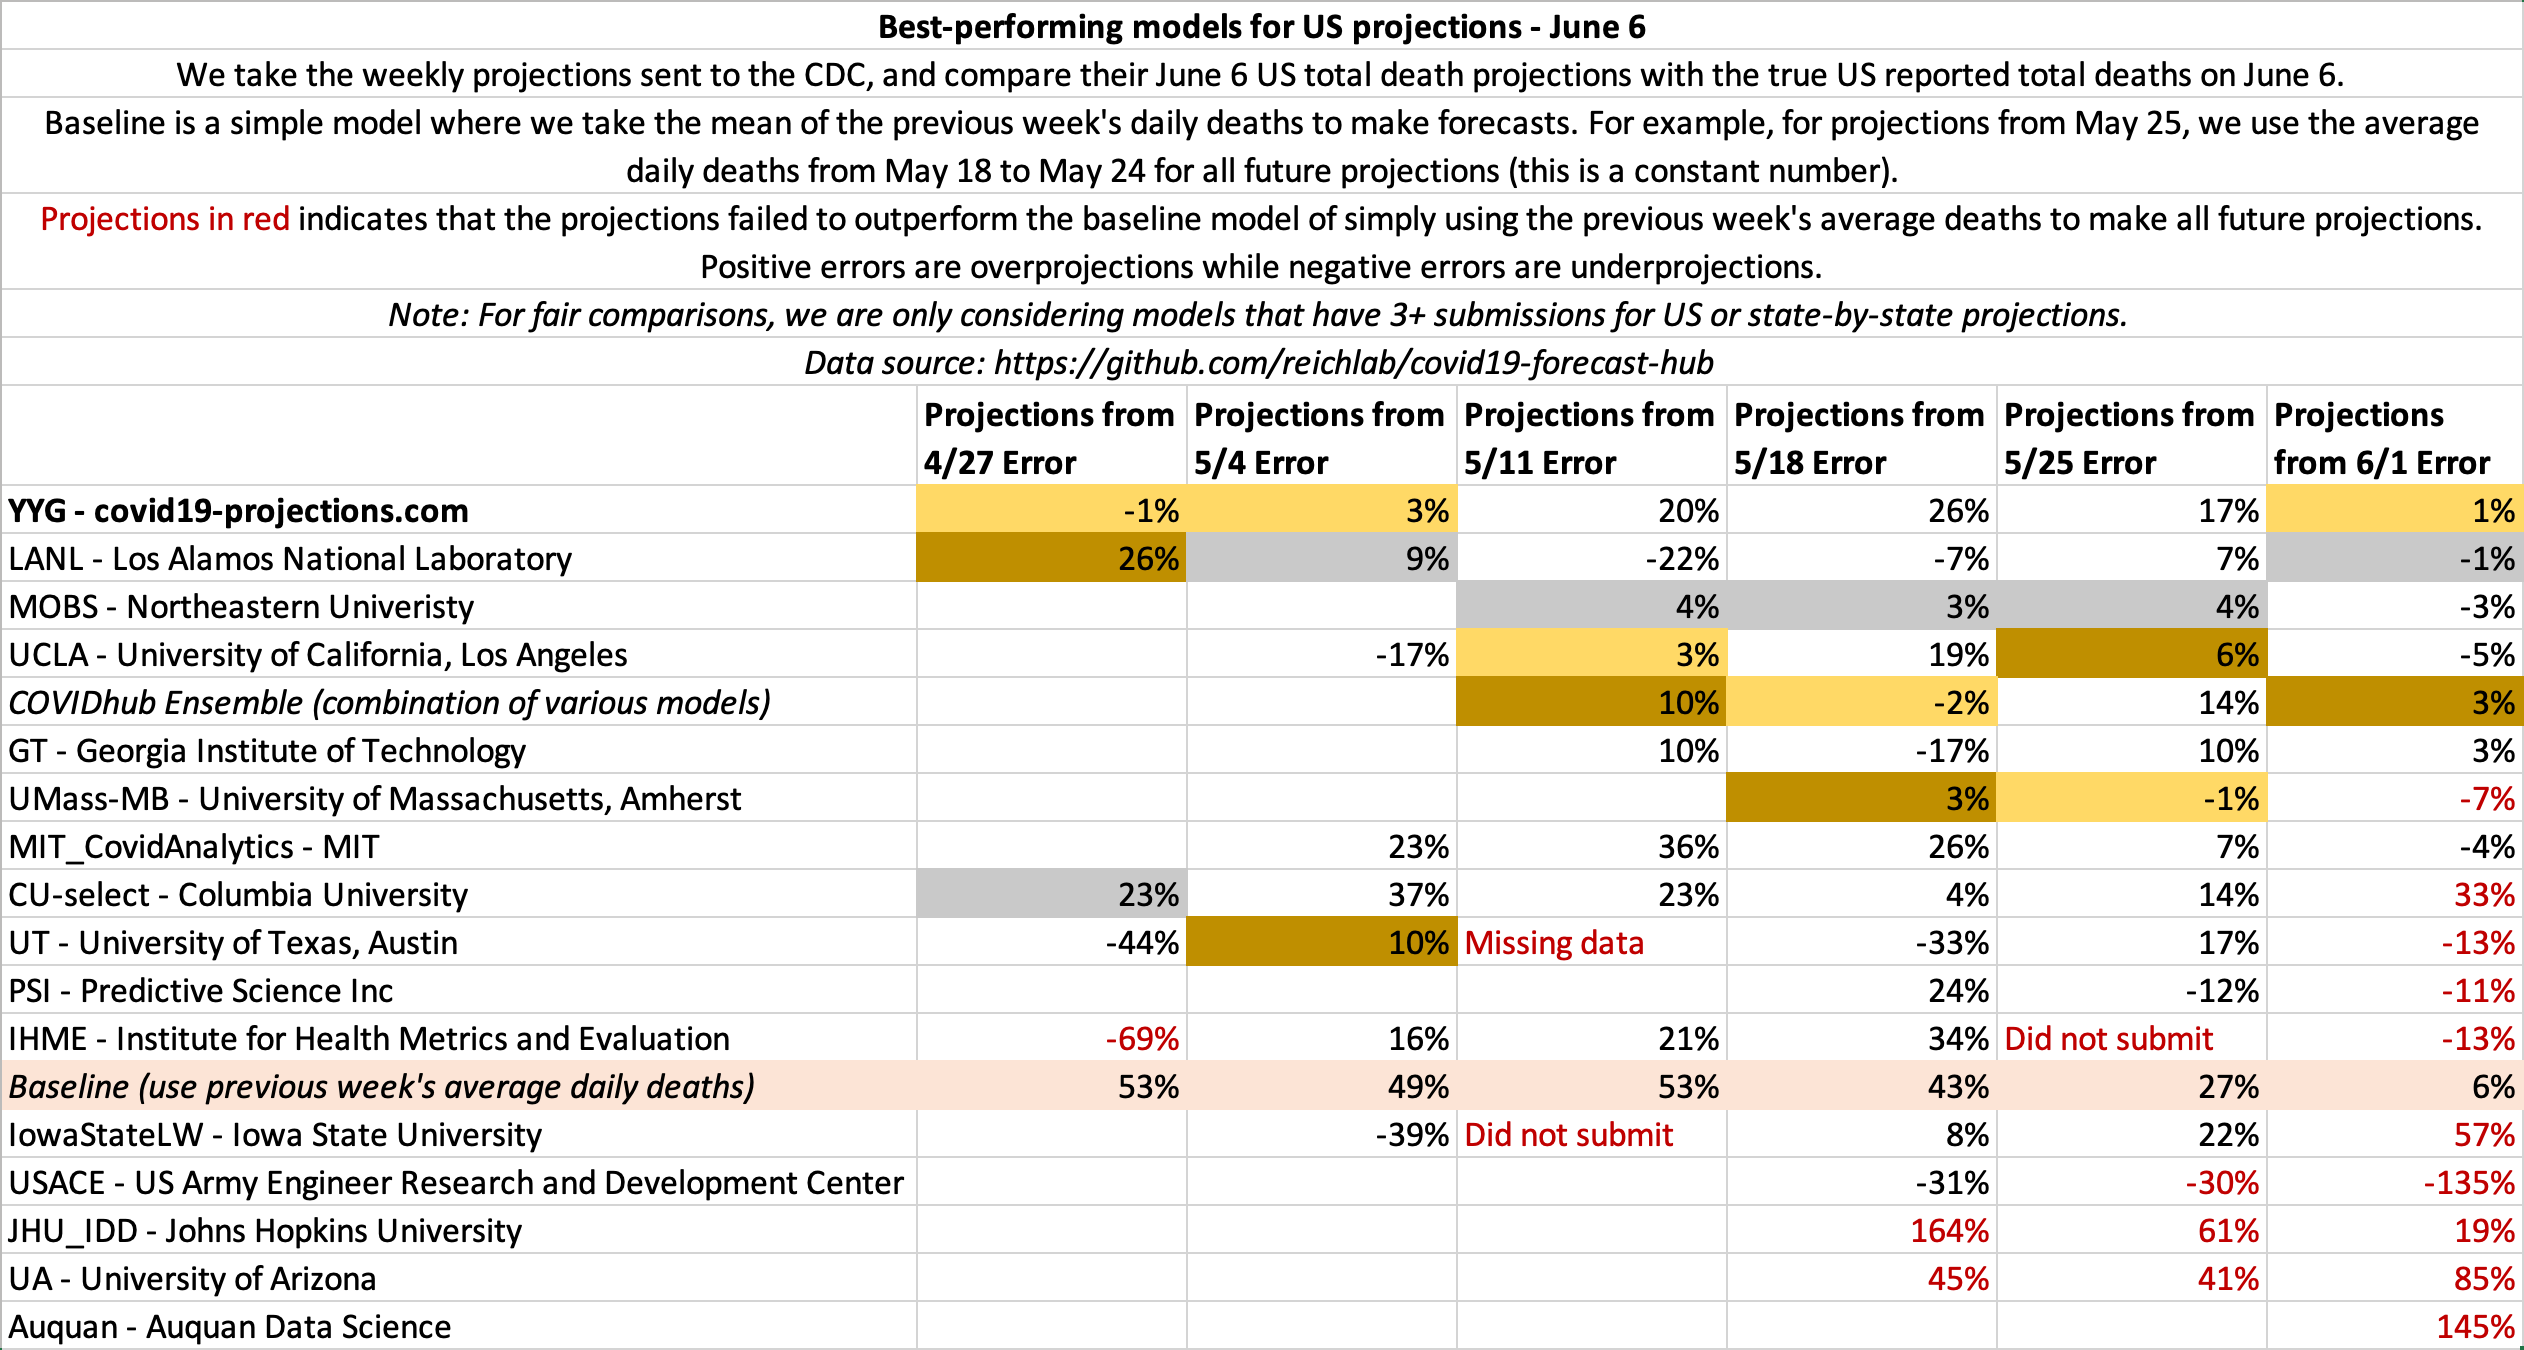
- June 6
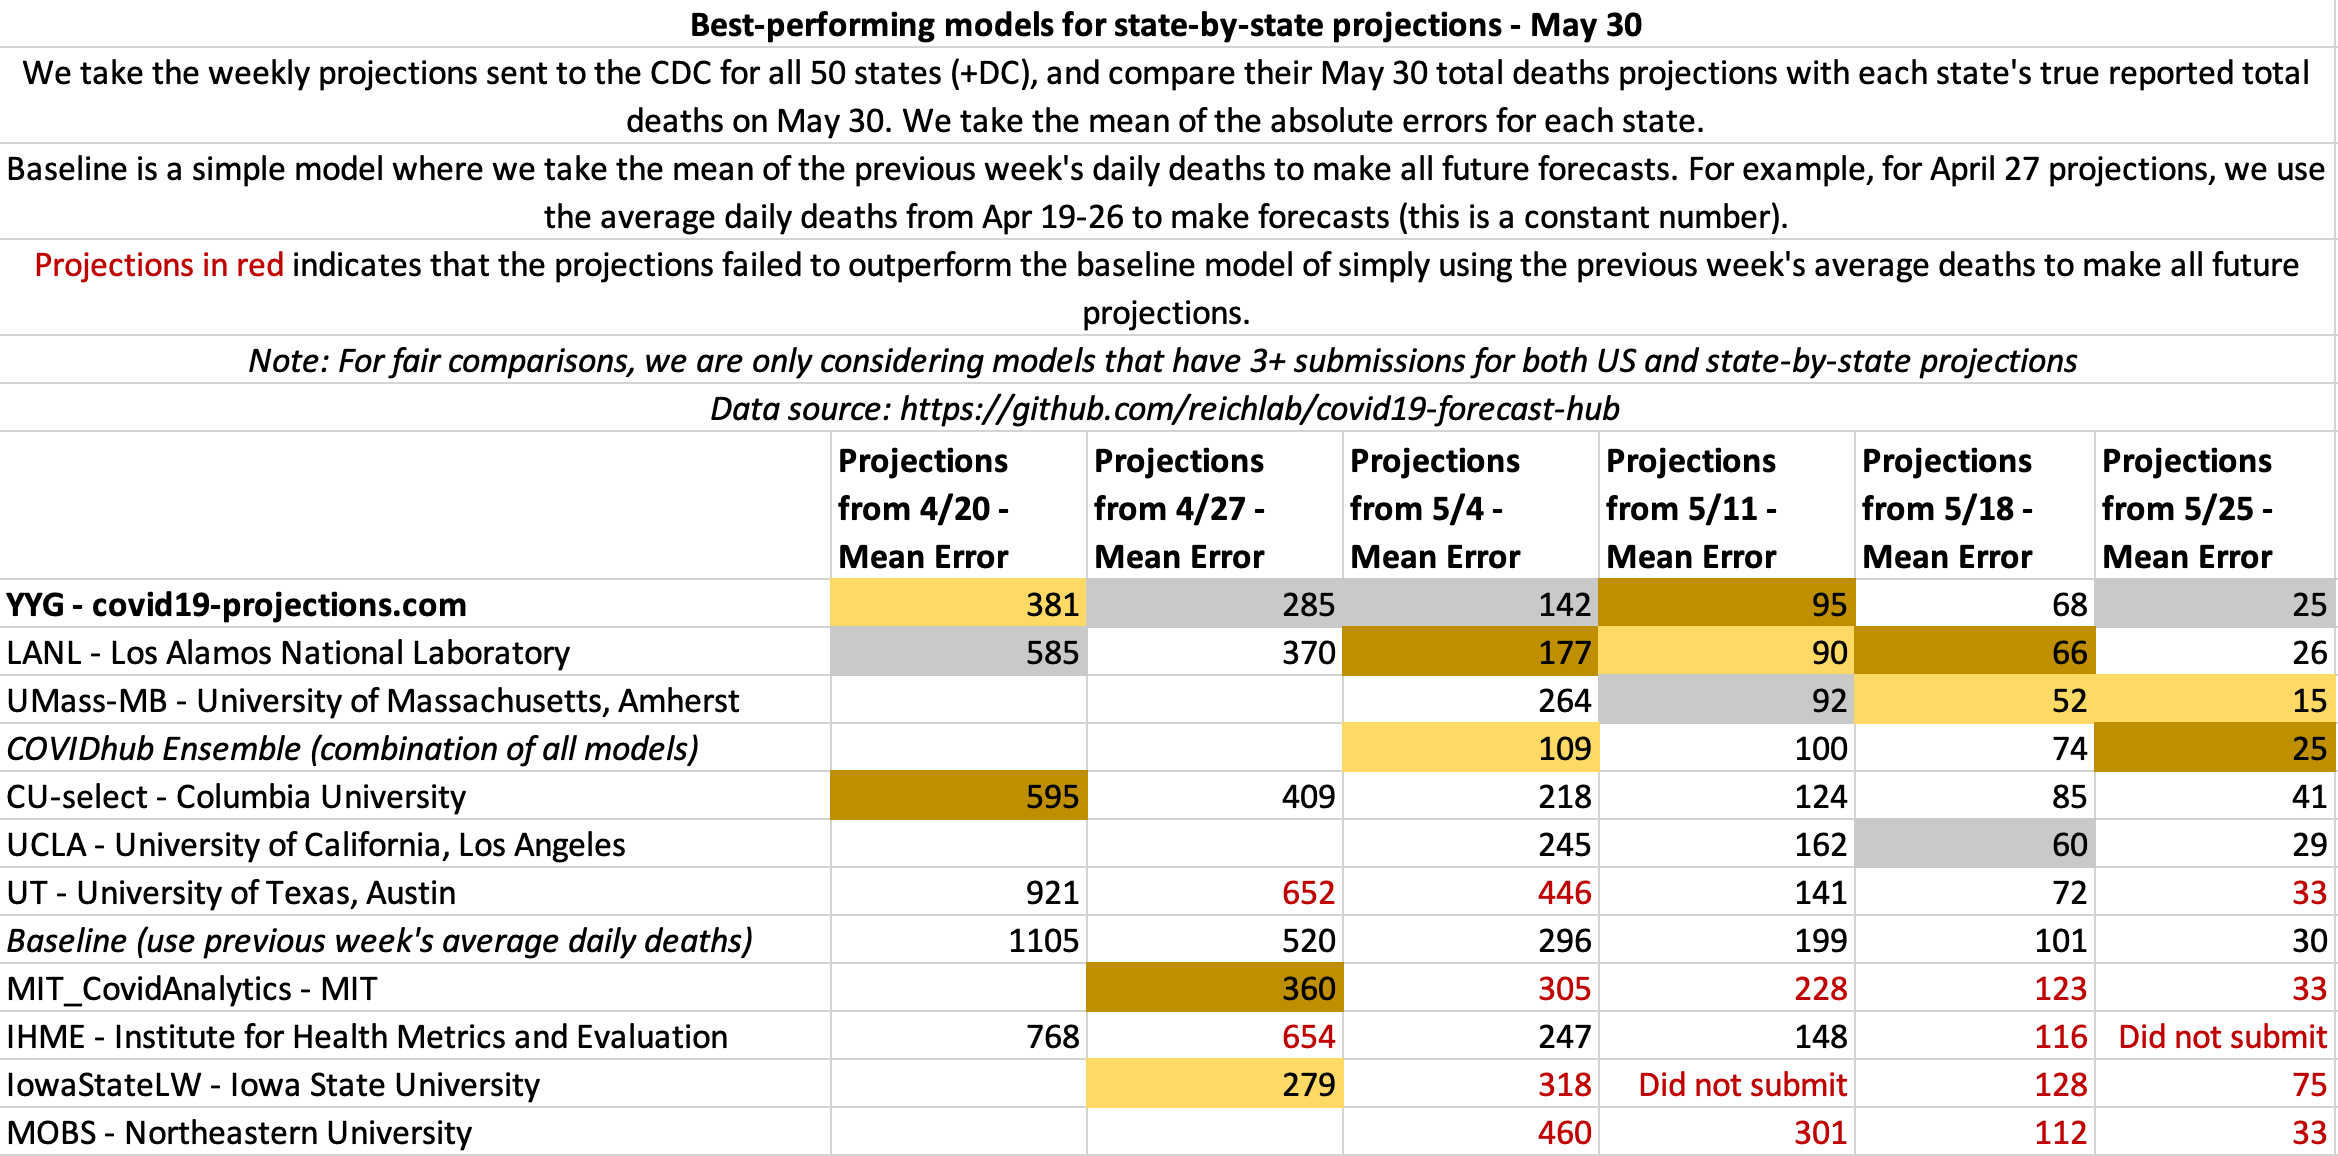
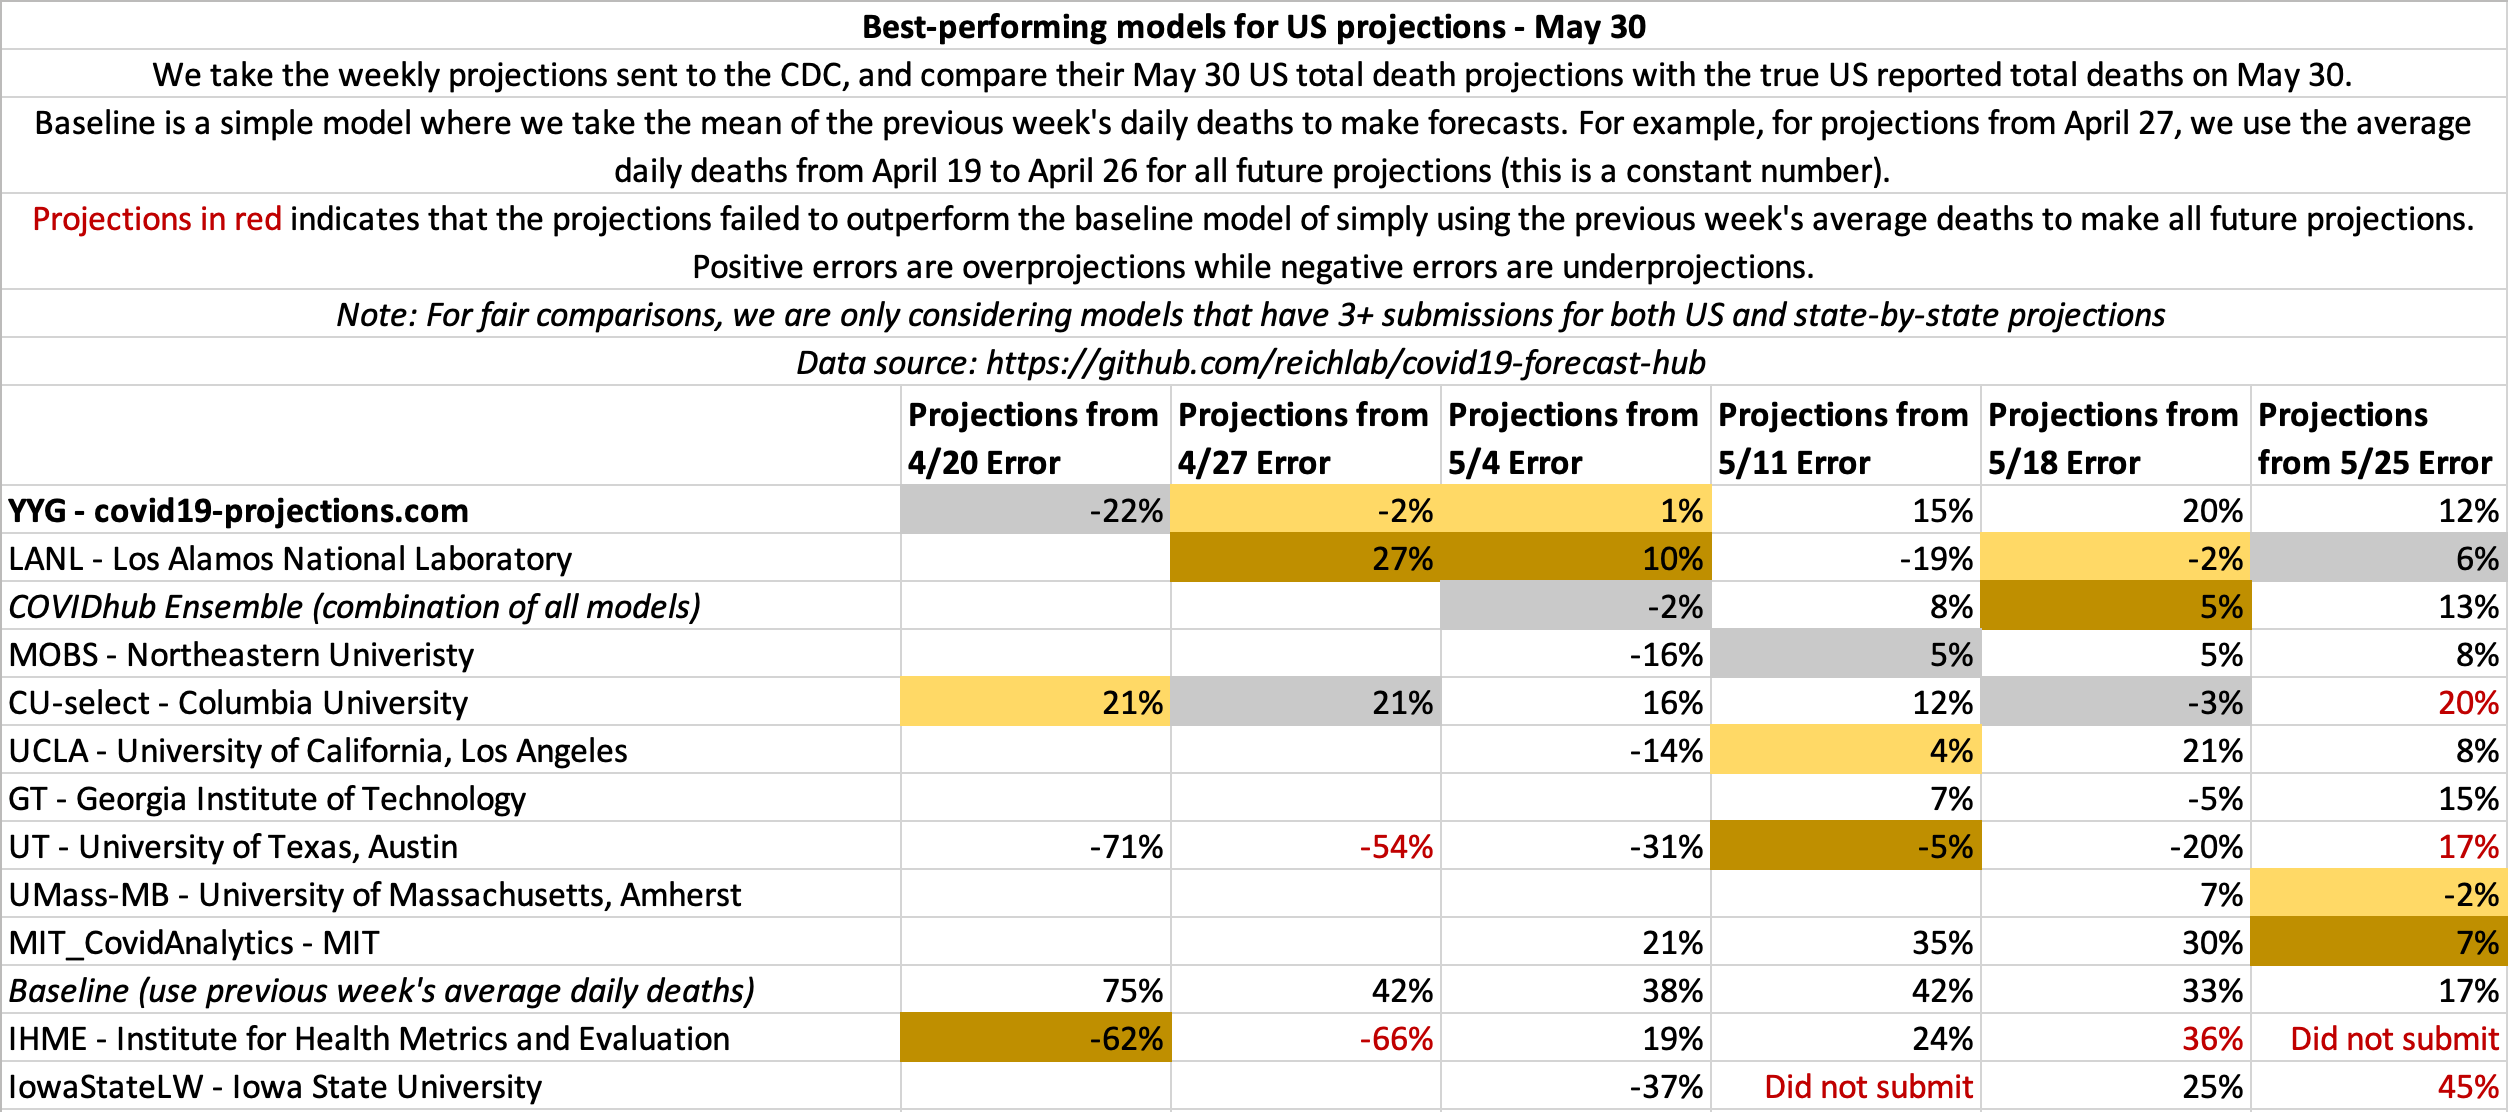
- May 30
- May 23
- May 16
- May 9
- May 2
Observations
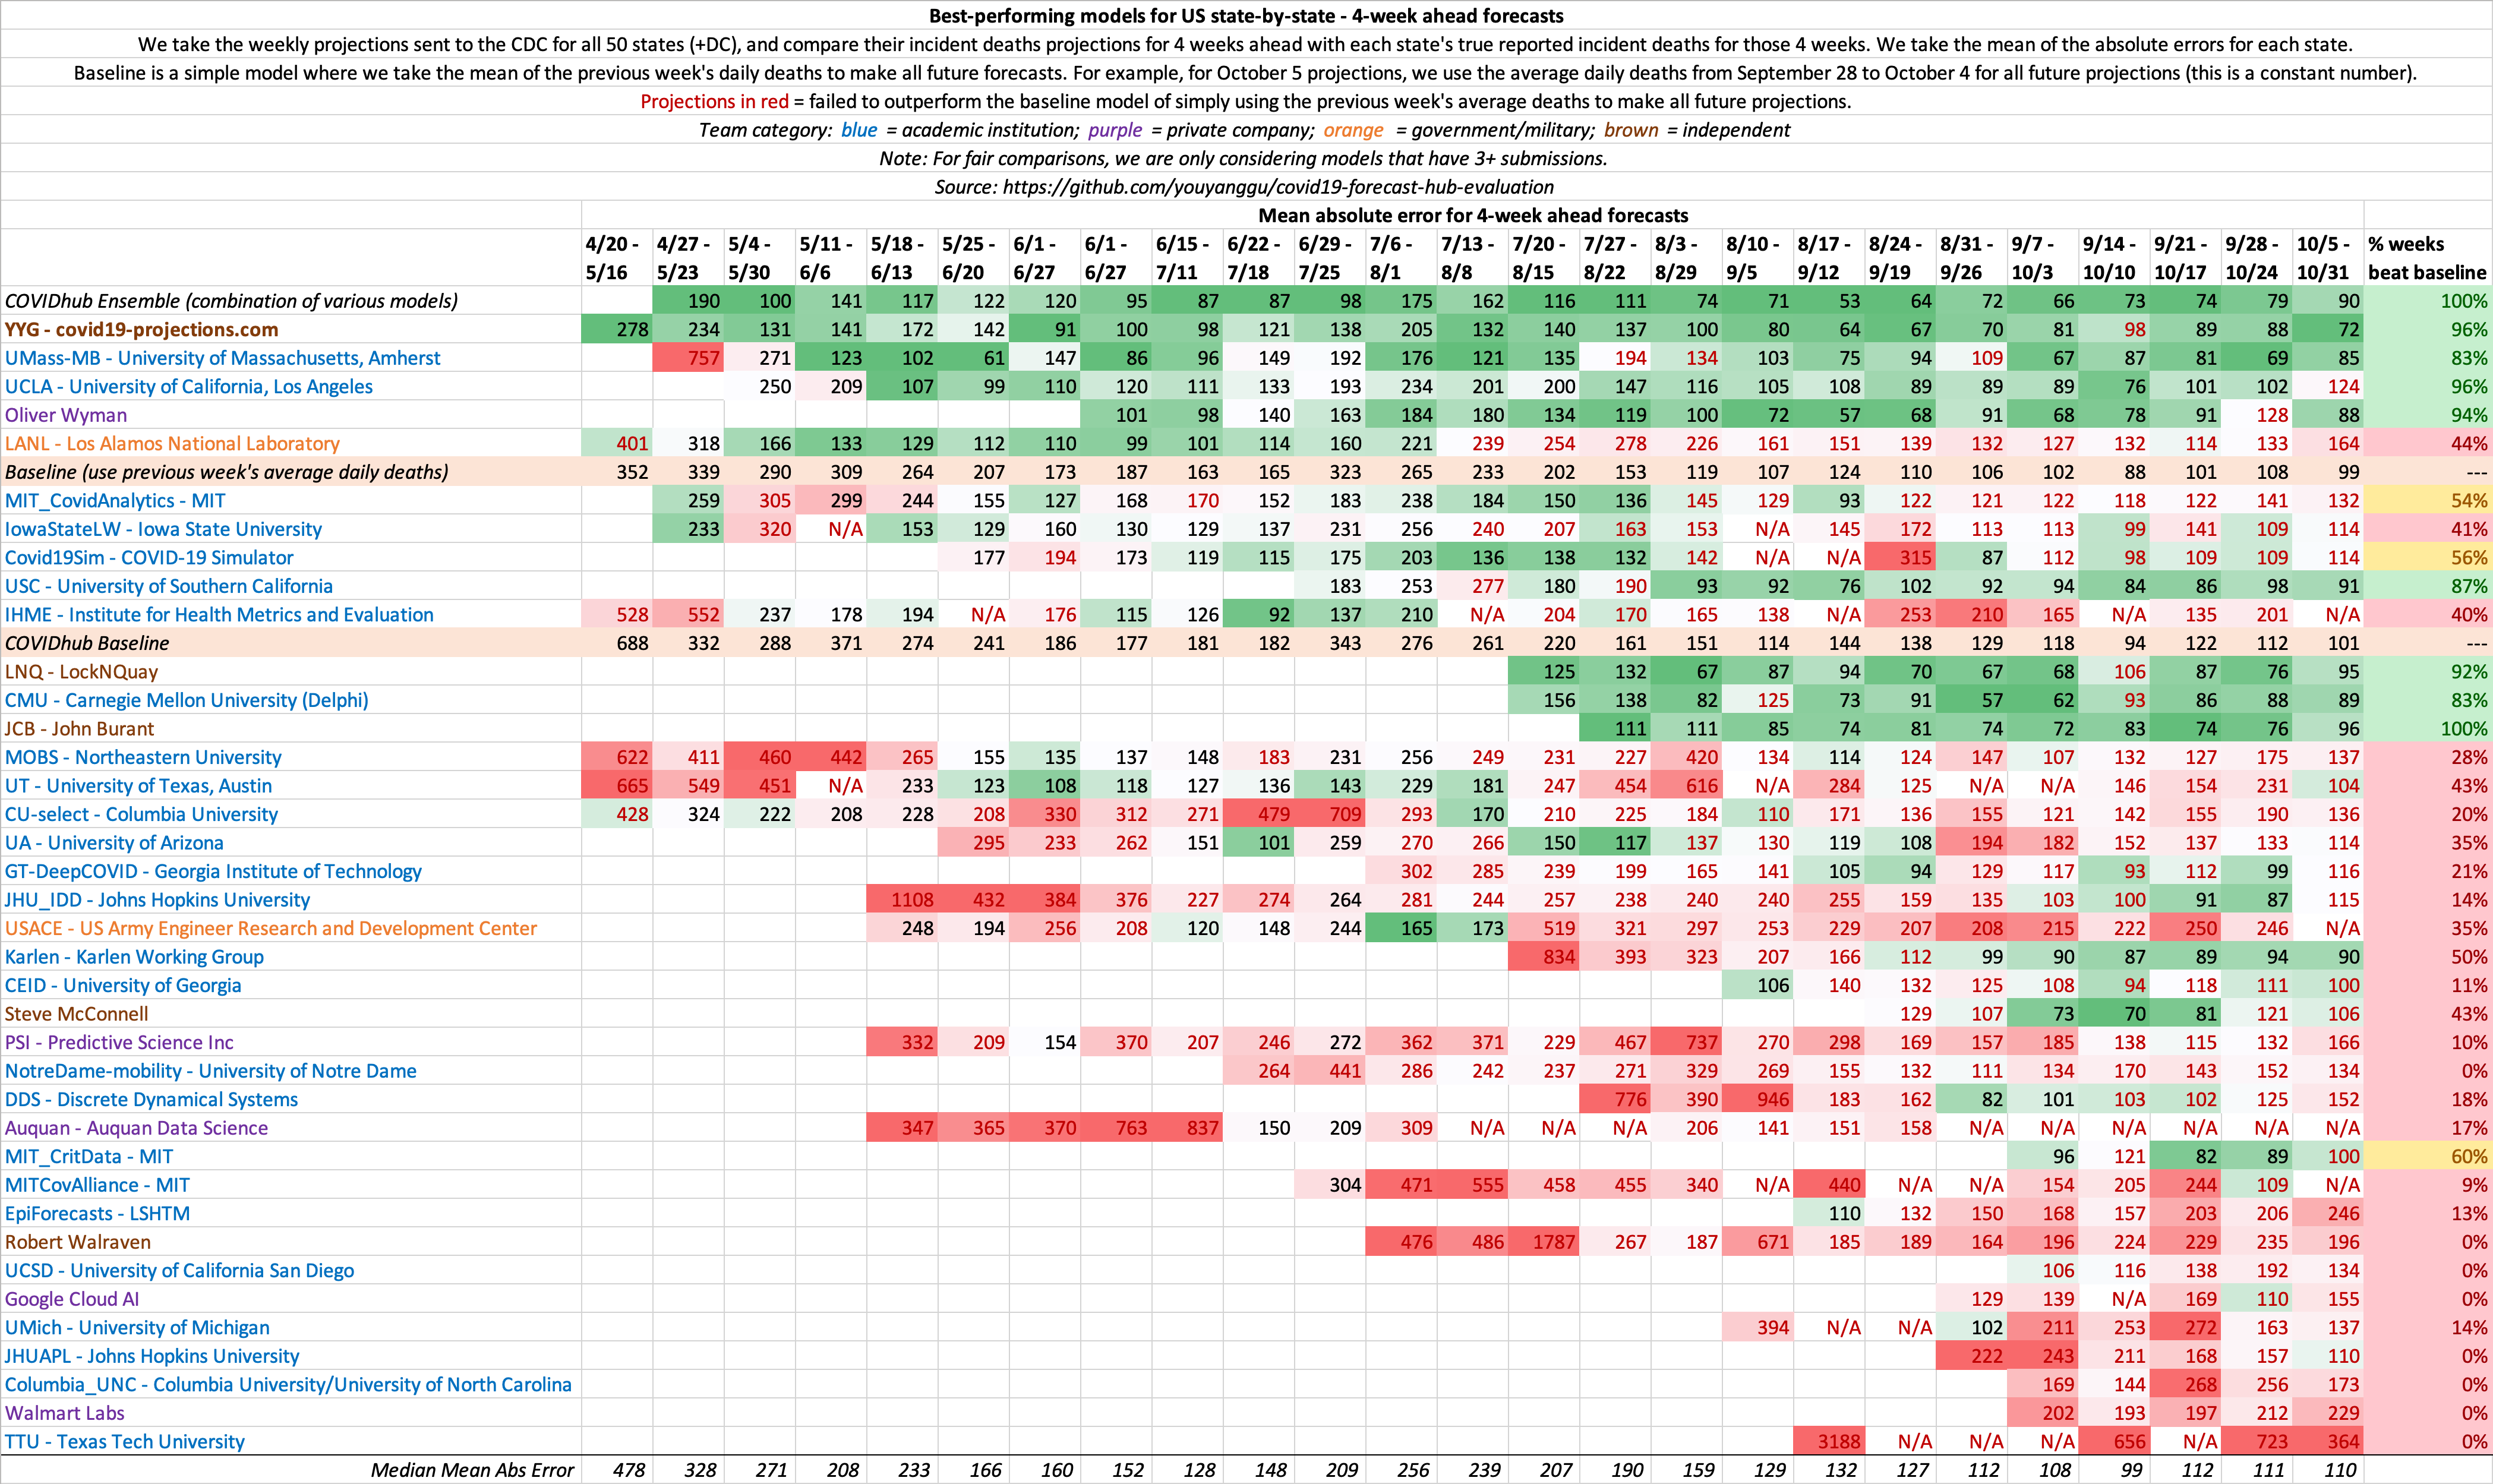
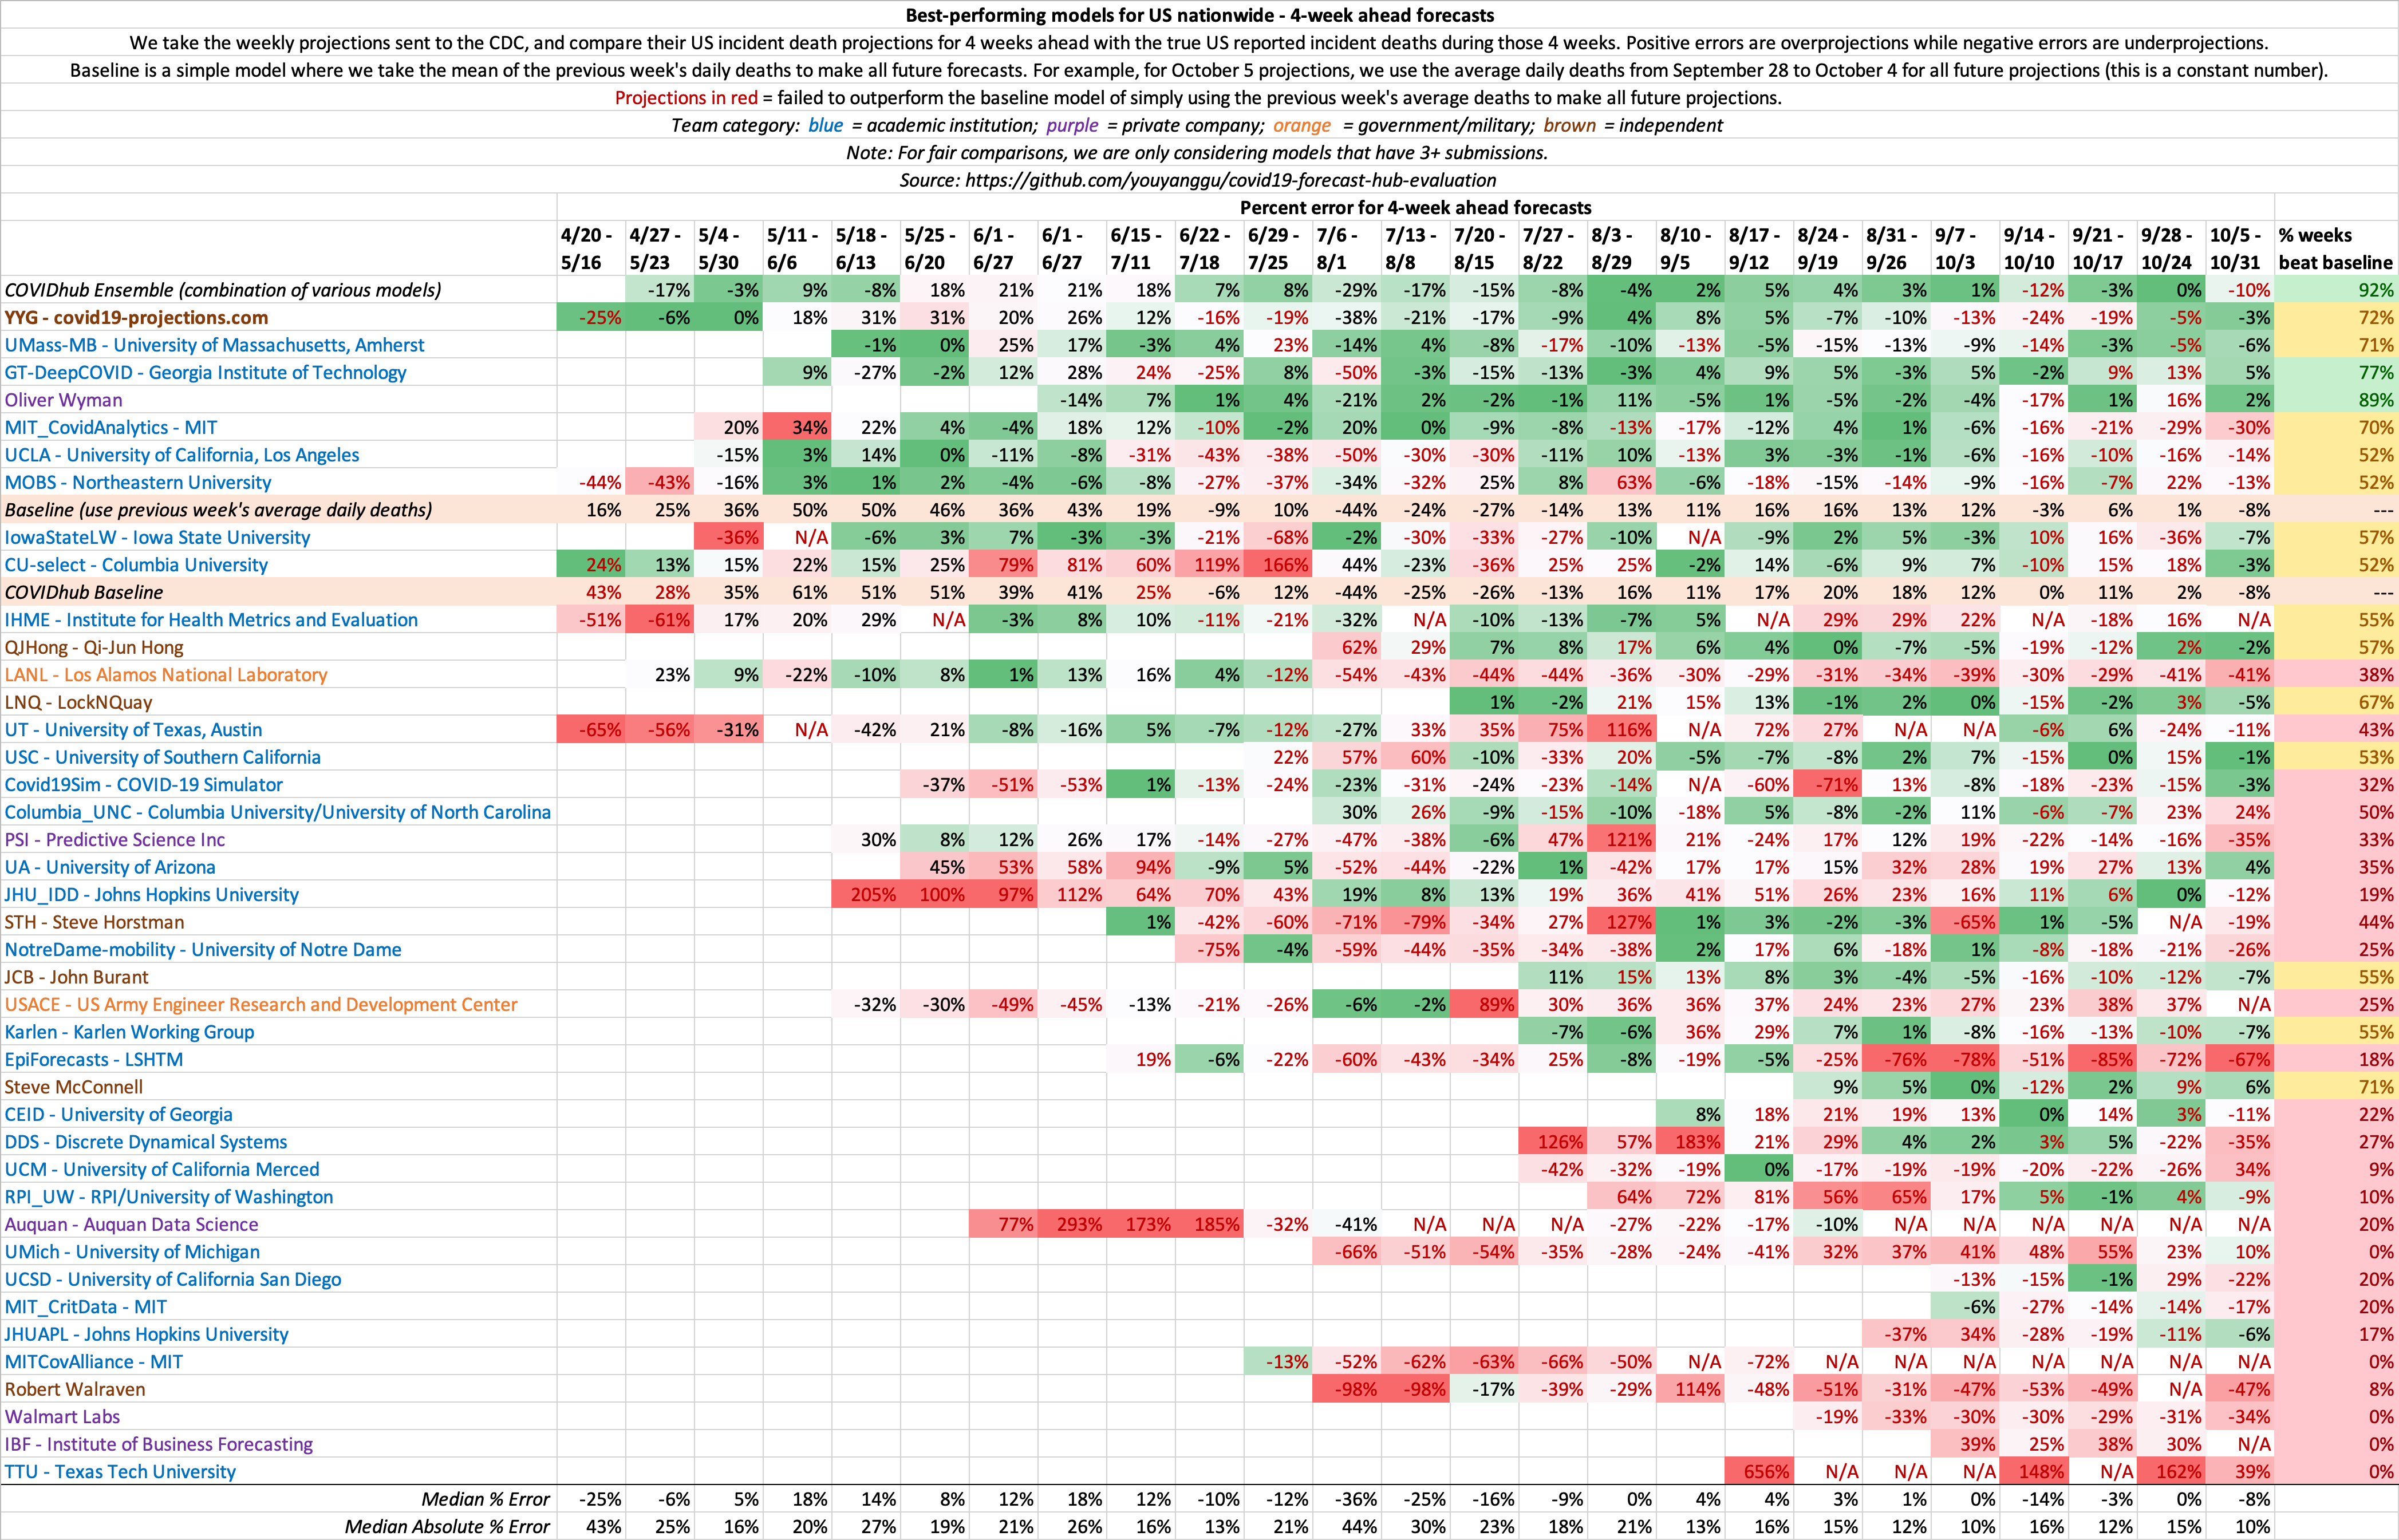
- A baseline model that simply uses the previous week’s average deaths to make future projections outperforms many models for short-term forecasts.
- Because US country-wide projections only contains a single forecast per week, there is much higher variance week-to-week compared to state-by-state projections, where there are 51 forecasts each week. As a result, we believe state-by-state evaluations is a better indicator of model performance. This same concept is why we play 7-game series for NBA/NHL/MLB playoffs.
- A handful of models consistently outperform the remainder of the models. The top 3 best-performing models every week for state-by-state projections almost always comes from one of these 5 models: covid19-projections.com, UCLA, Los Alamos (LANL), UMass Amherst, COVIDhub Ensemble.
- The COVIDhub ensemble model is created by taking a combination of all eligible models that submit projections to the CDC. Our projections are included in this ensemble.
- For state-by-state projections, we evaluate all models that have 4+ week projections for more than 40 states. For models with missing state projections, we use the mean projection for that state (among all the models).
- While past performance is not necessarily indicative of future performance, we believe it’s important to consider a model’s historical accuracy and not just a model’s future forecasts and/or the creator’s name recognition. It is also important to make sure that a model can perform better than the baseline.
- We welcome and encourage independent model evaluations. See here for an evaluation from a PhD data scientist at NASA Ames.
Additional Notes
- Prior to September 12, our 2+ week target calculations for models with only incident deaths forecasts were incorrect. This included the following models: CMU, LNQ, STH. This has since been retroactively corrected on the GitHub repository, but are not reflected in the charts dated before September 12.
- Prior to June 20, the YYG model was the top row by default. Other than that, the ordering follows the mean weekly ranks.
4 Week Ahead
This is a metric that shows the consistency of model projections over the period of several months. 4 weeks ahead is long enough into the future that it requires non-trivial methods, yet short enough that it does not require excessive assumptions. Hence, we believe it is the ideal metric to compare models.
State-by-state projections
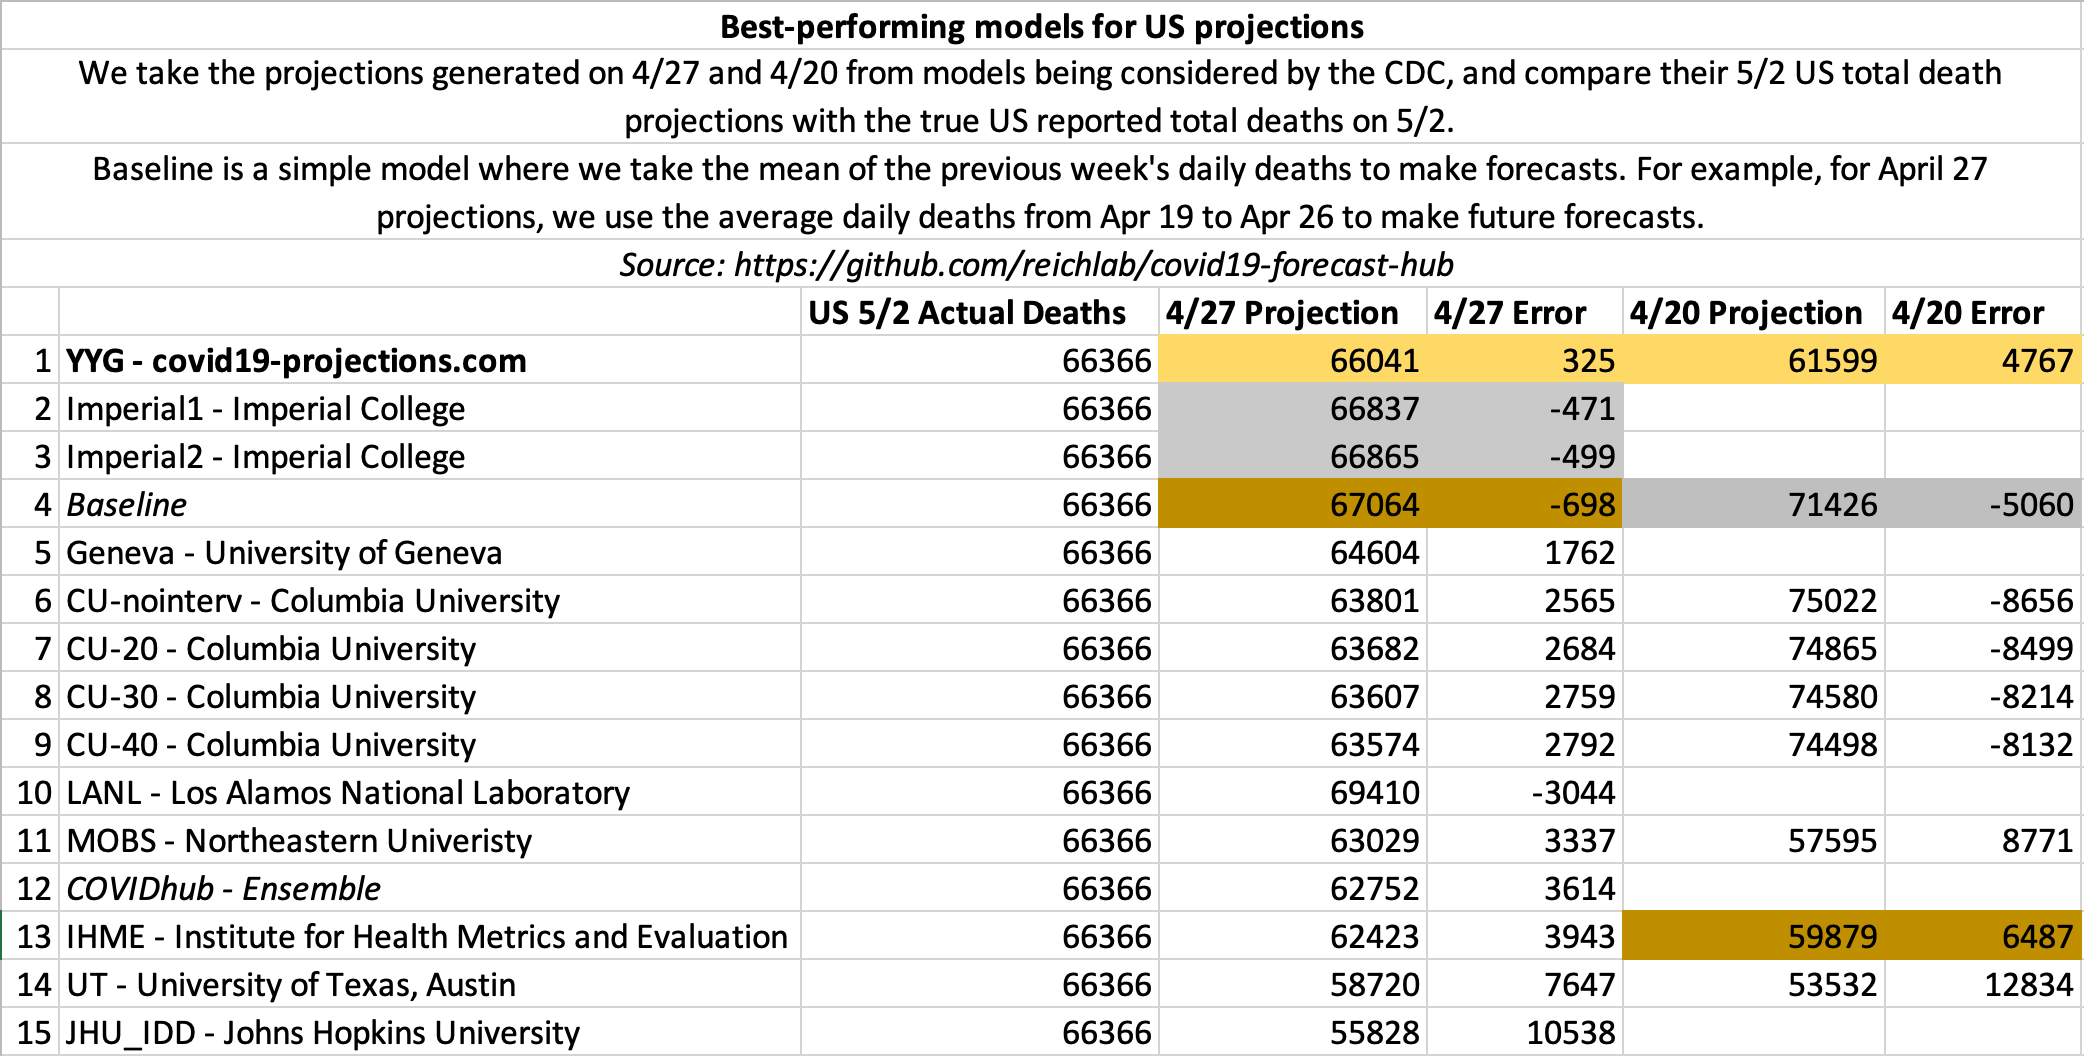
US projections
October 3
The below metrics show the recent accuracy of model projections for the specified dates.
State-by-state projections
US projections
September 26
State-by-state projections
US projections
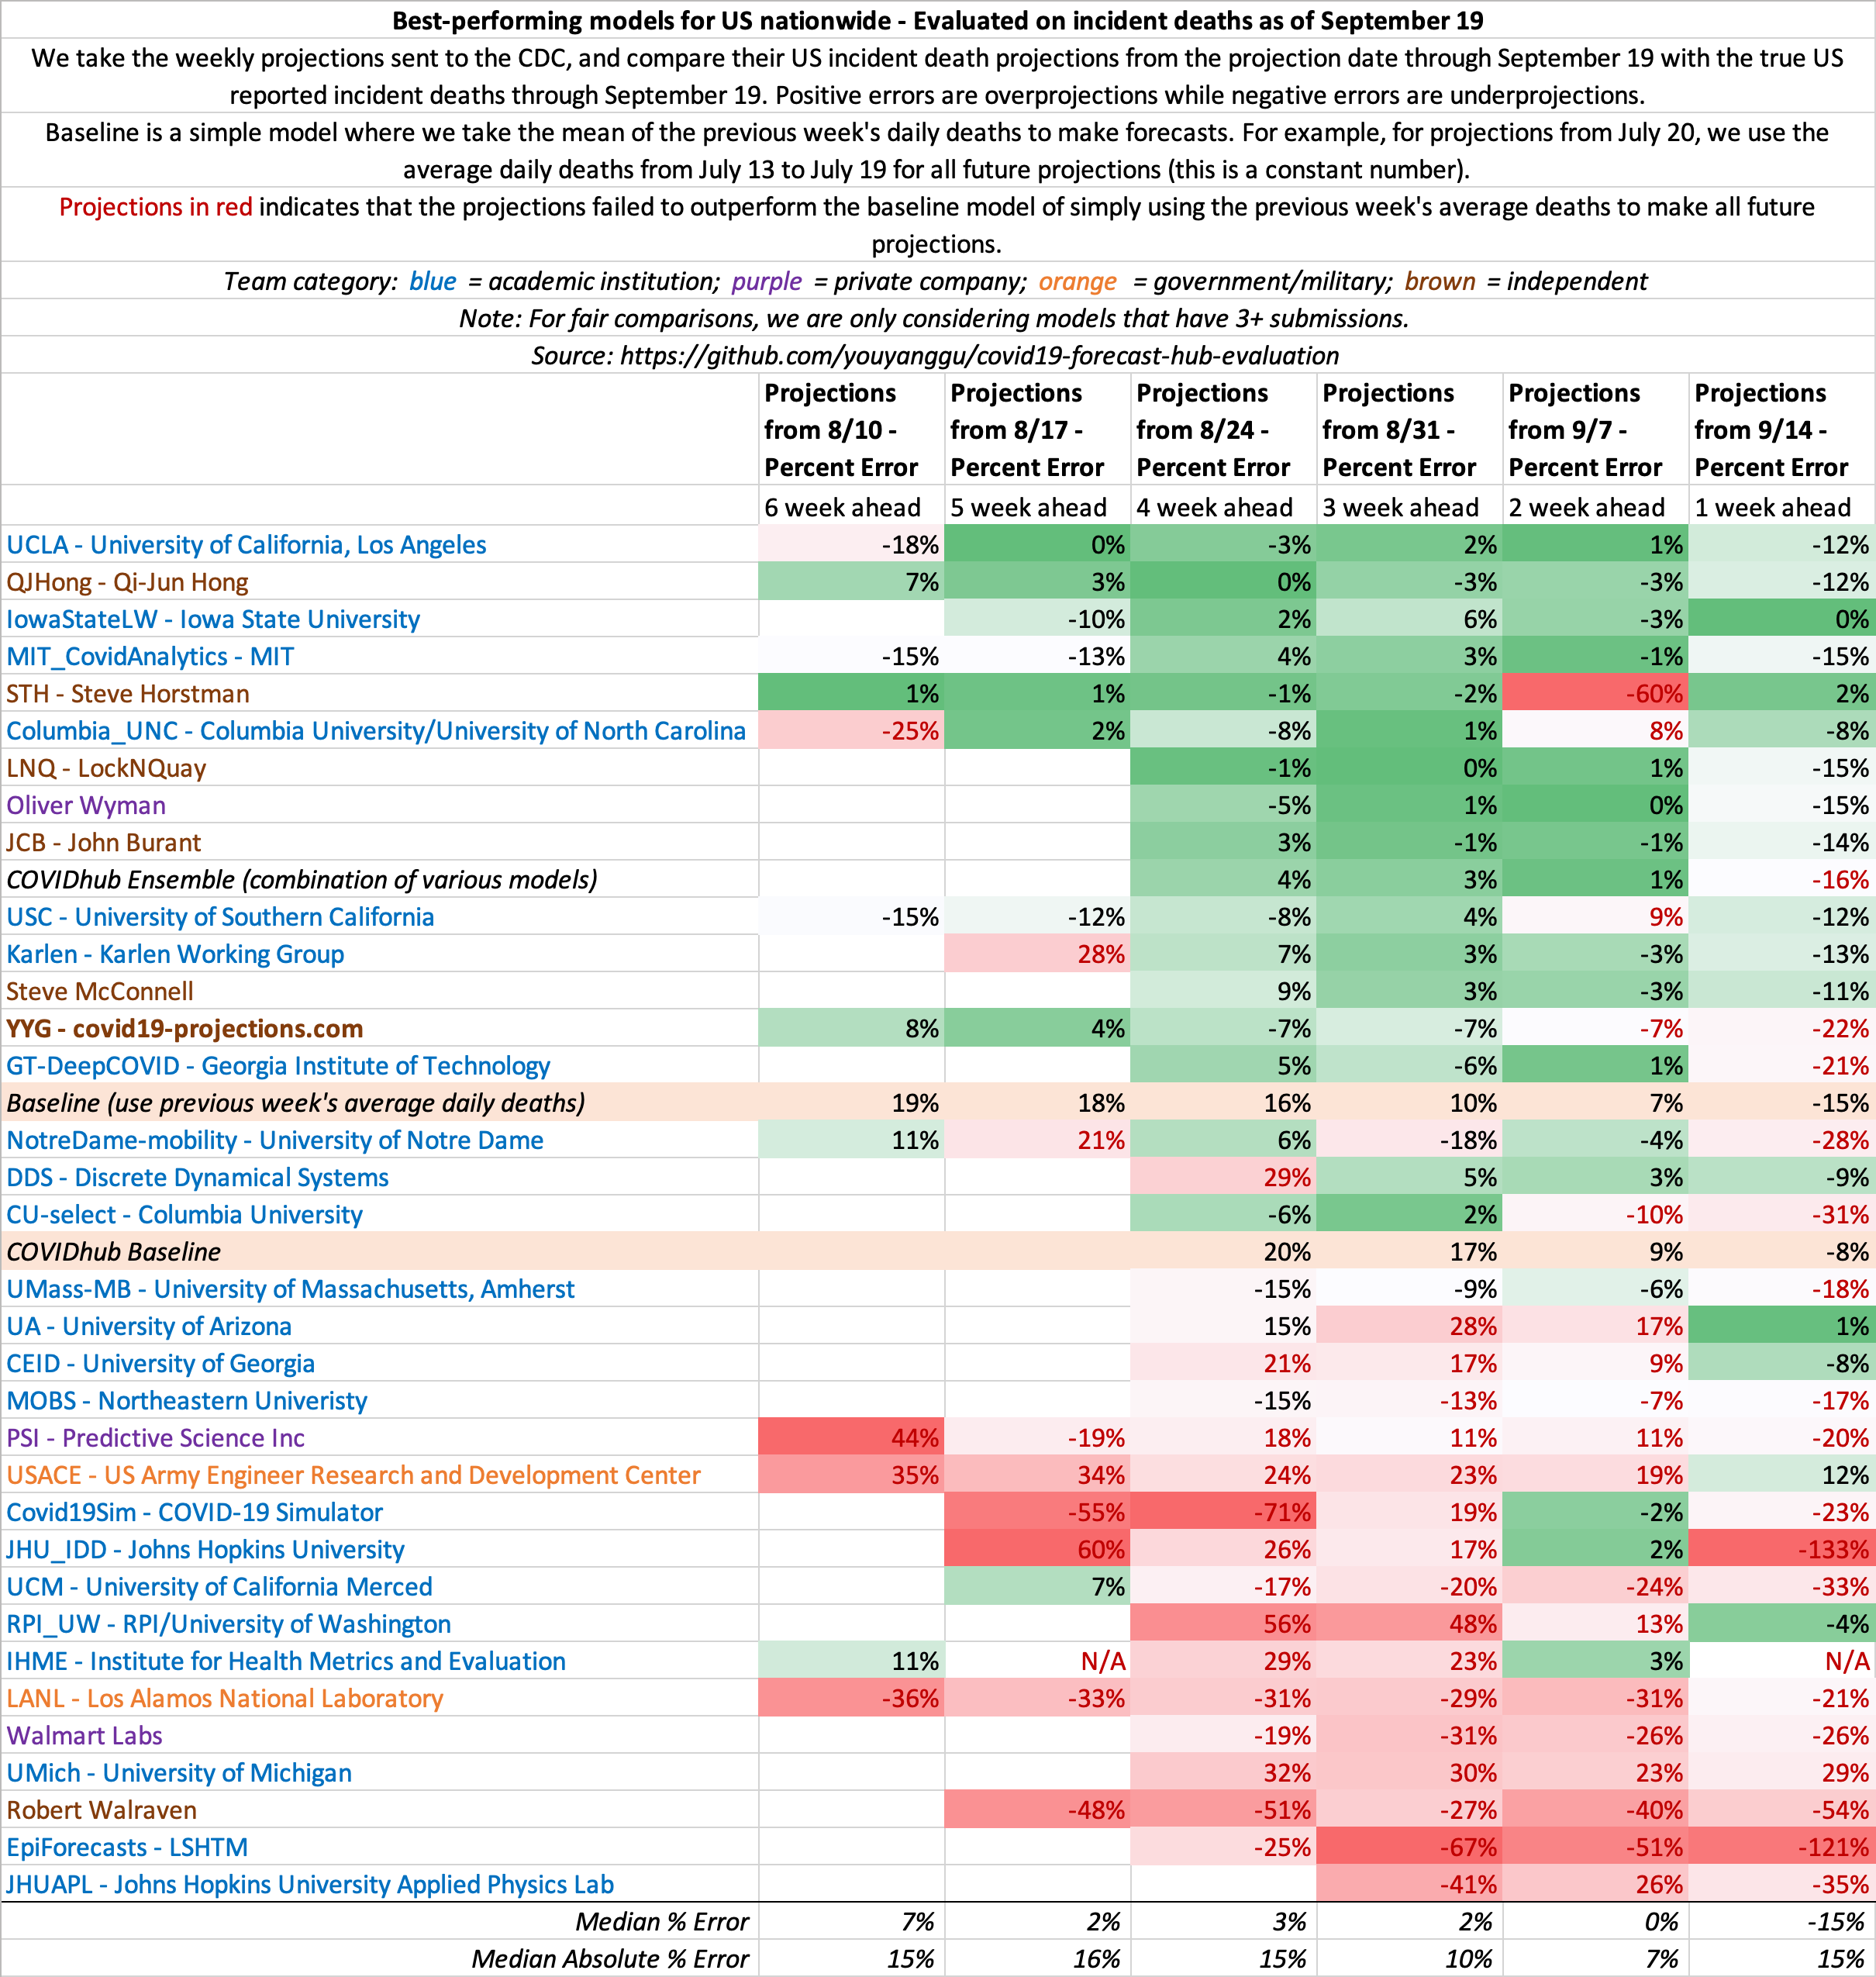
September 19
State-by-state projections
US projections
September 12
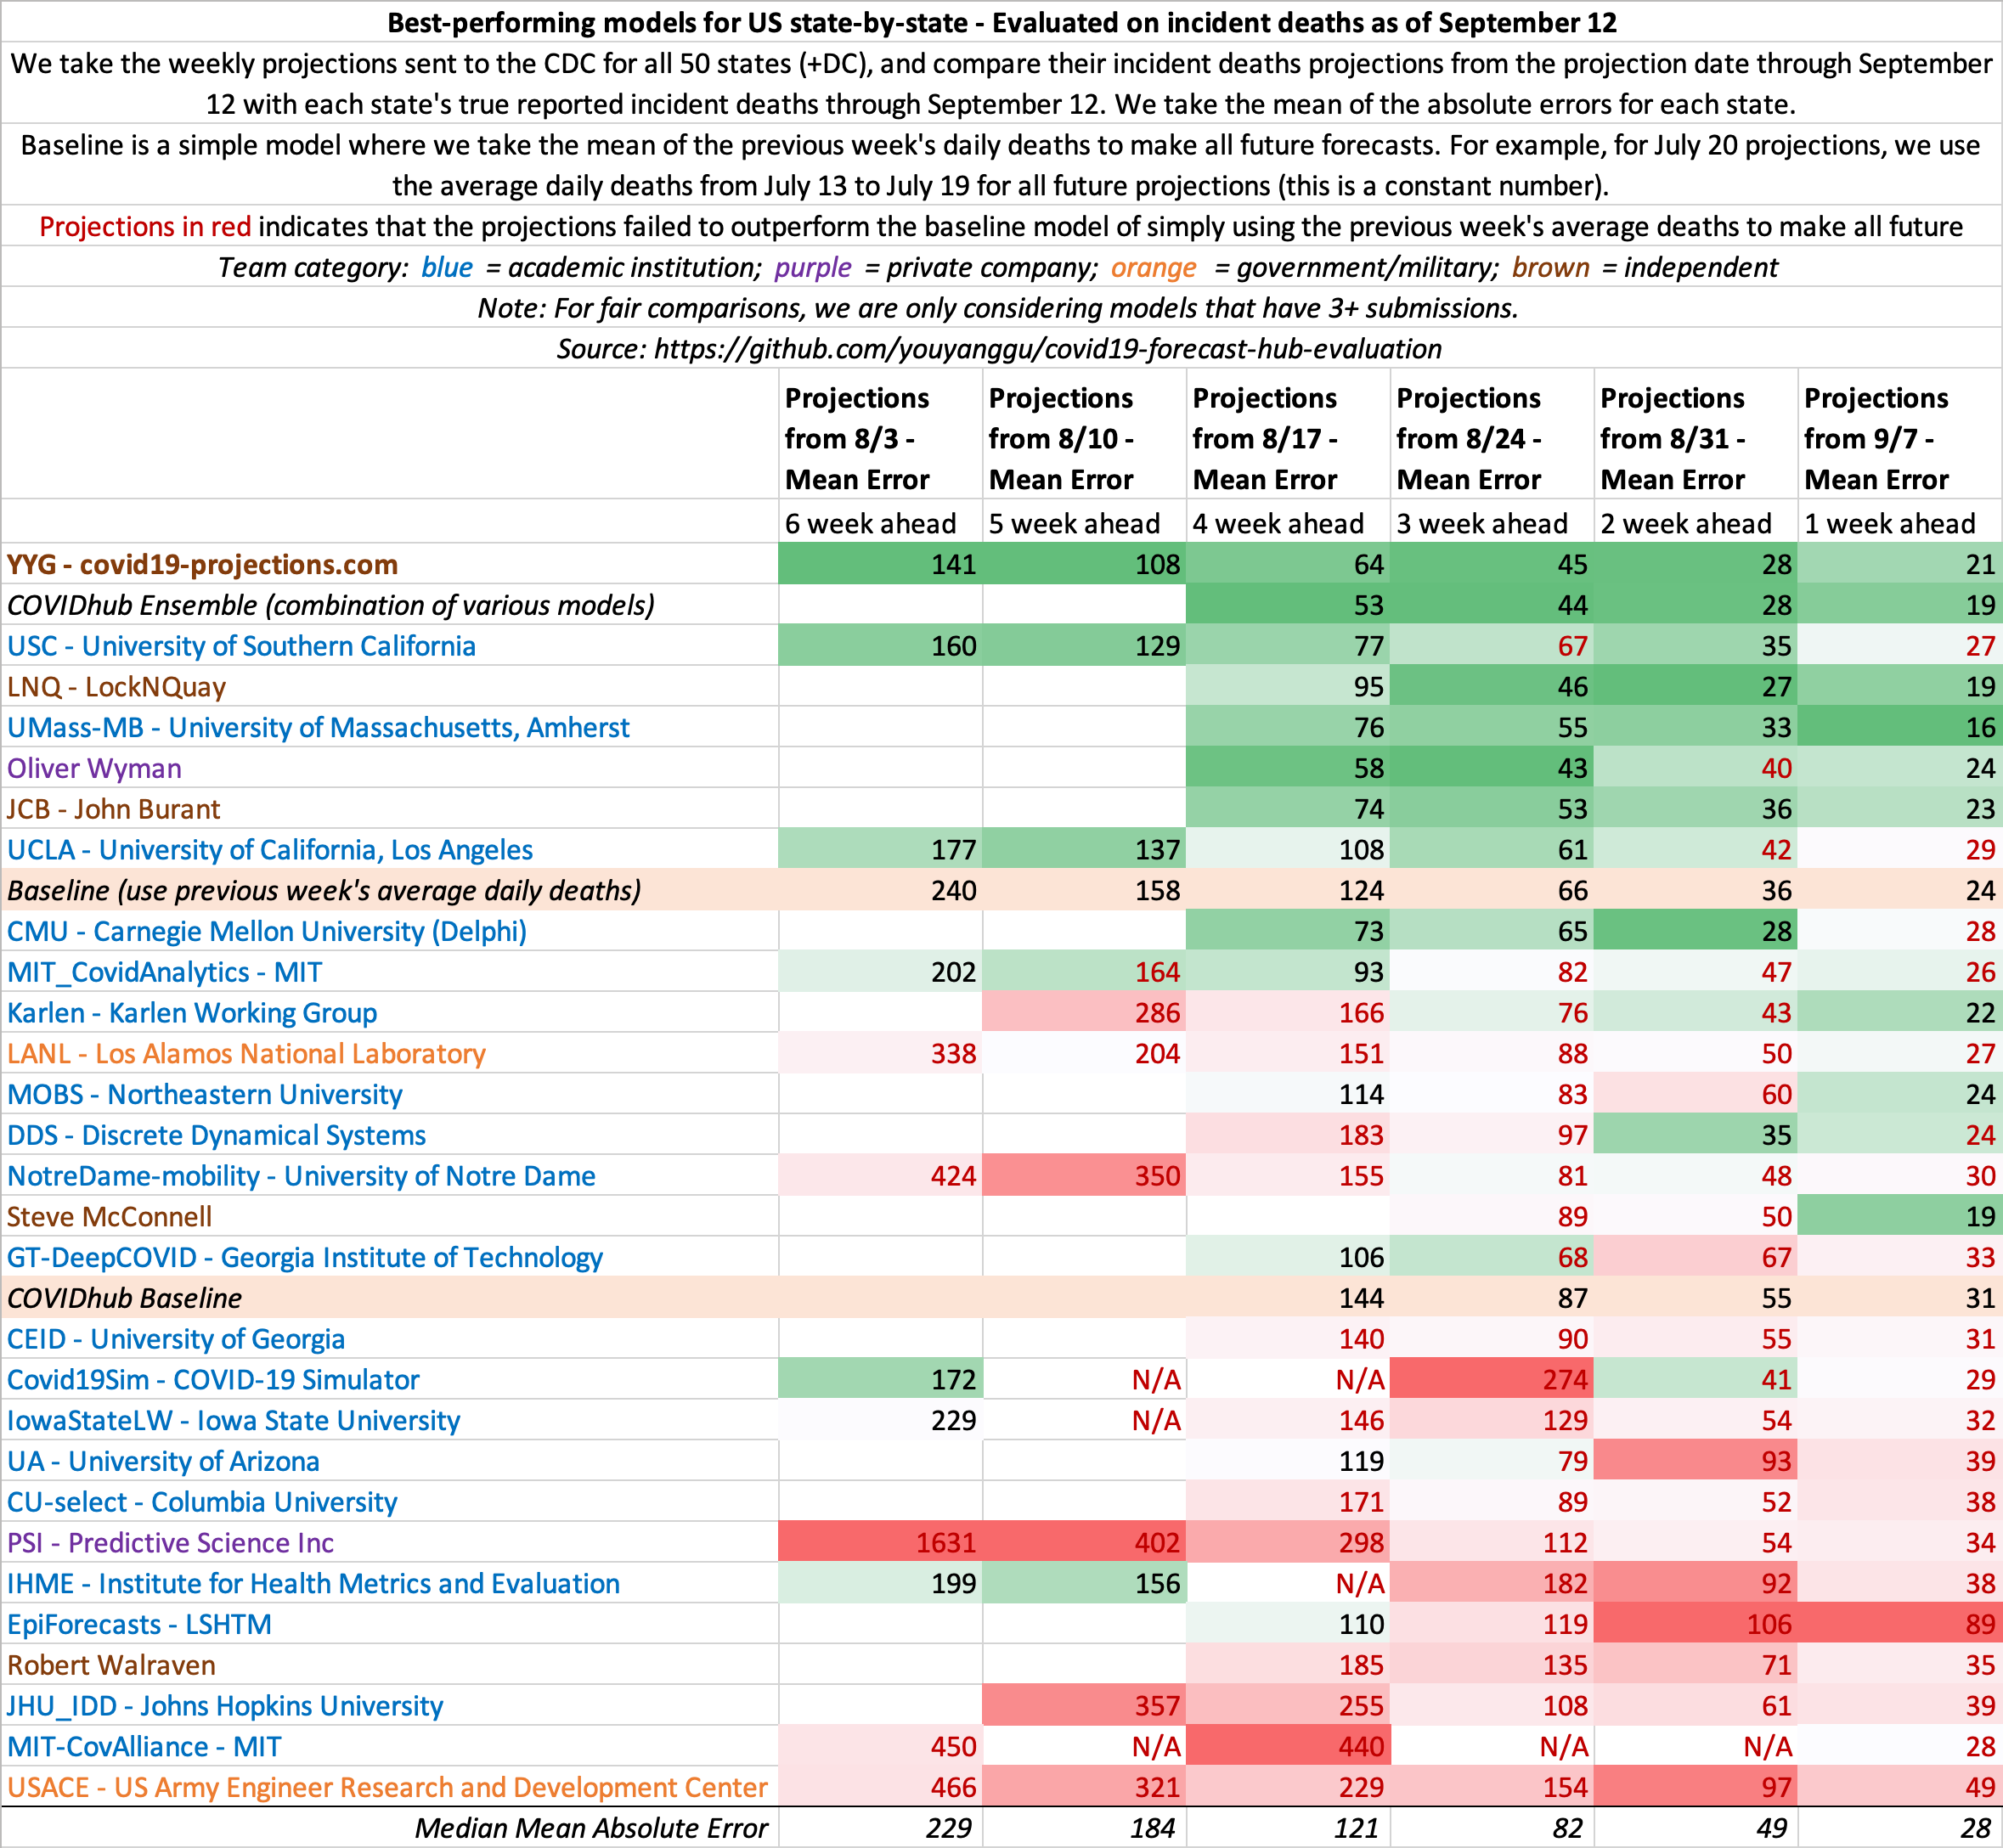
State-by-state projections
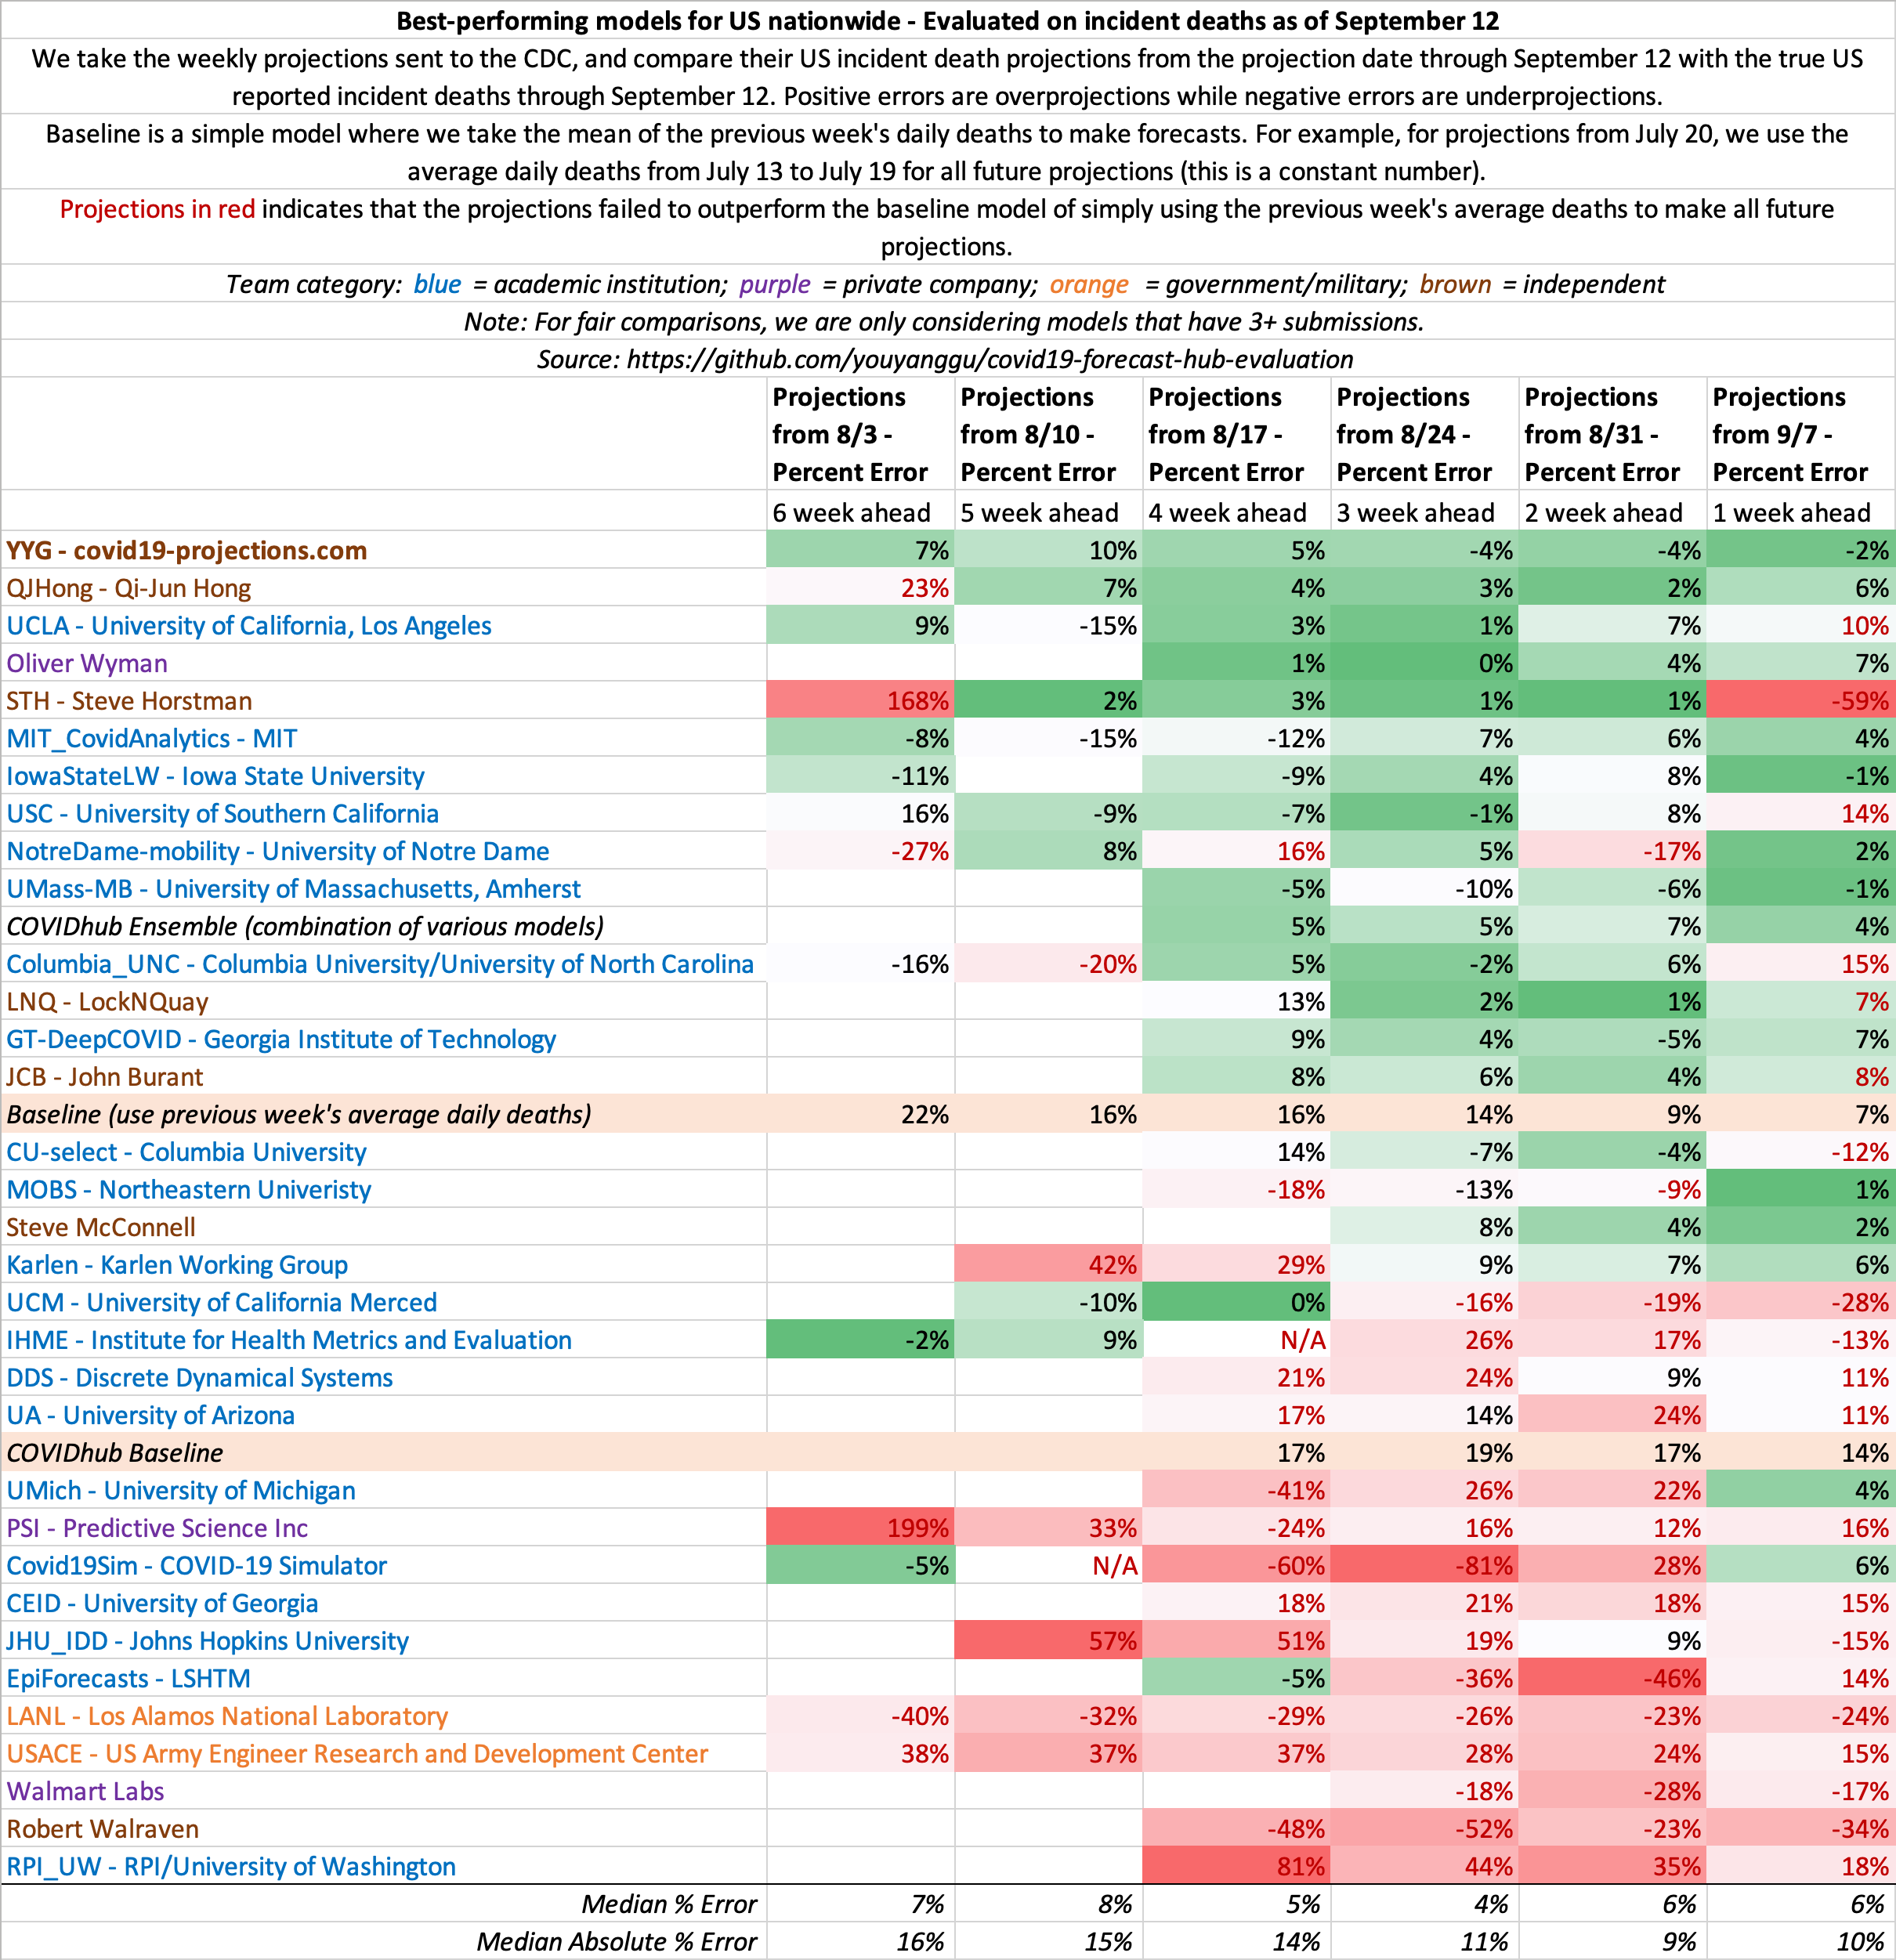
US projections
September 5
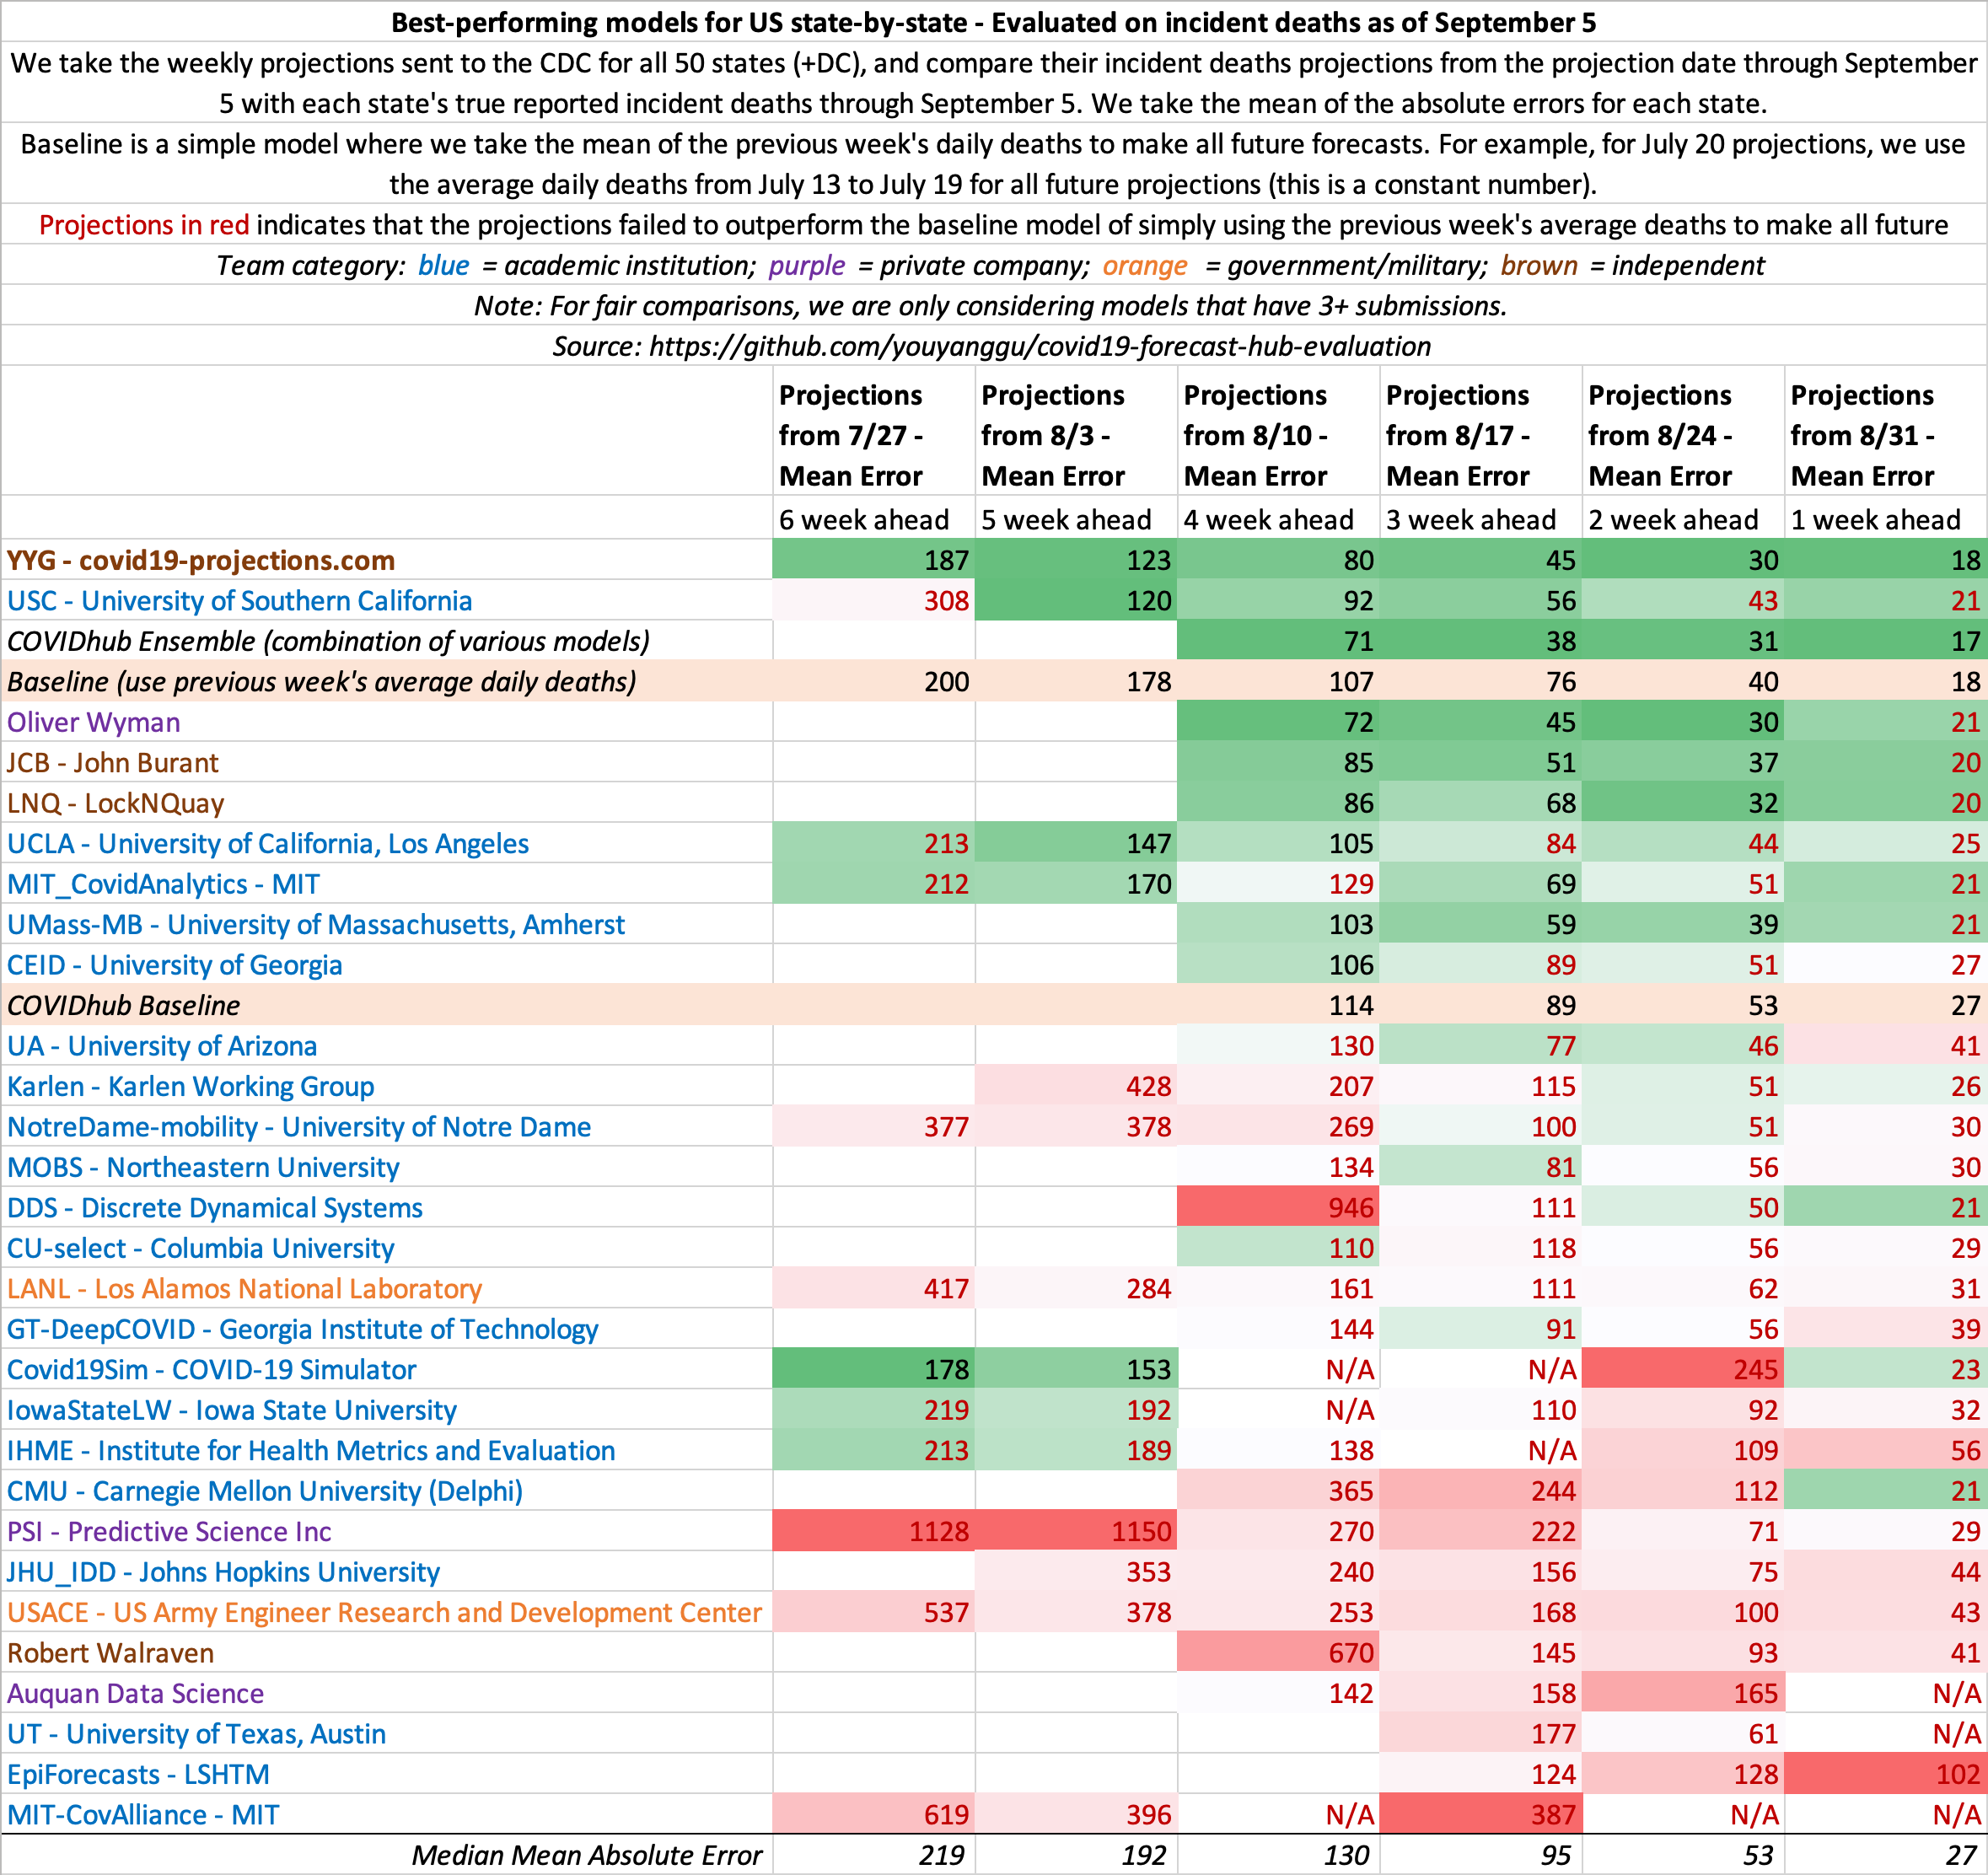
State-by-state projections
US projections
August 29
State-by-state projections
US projections
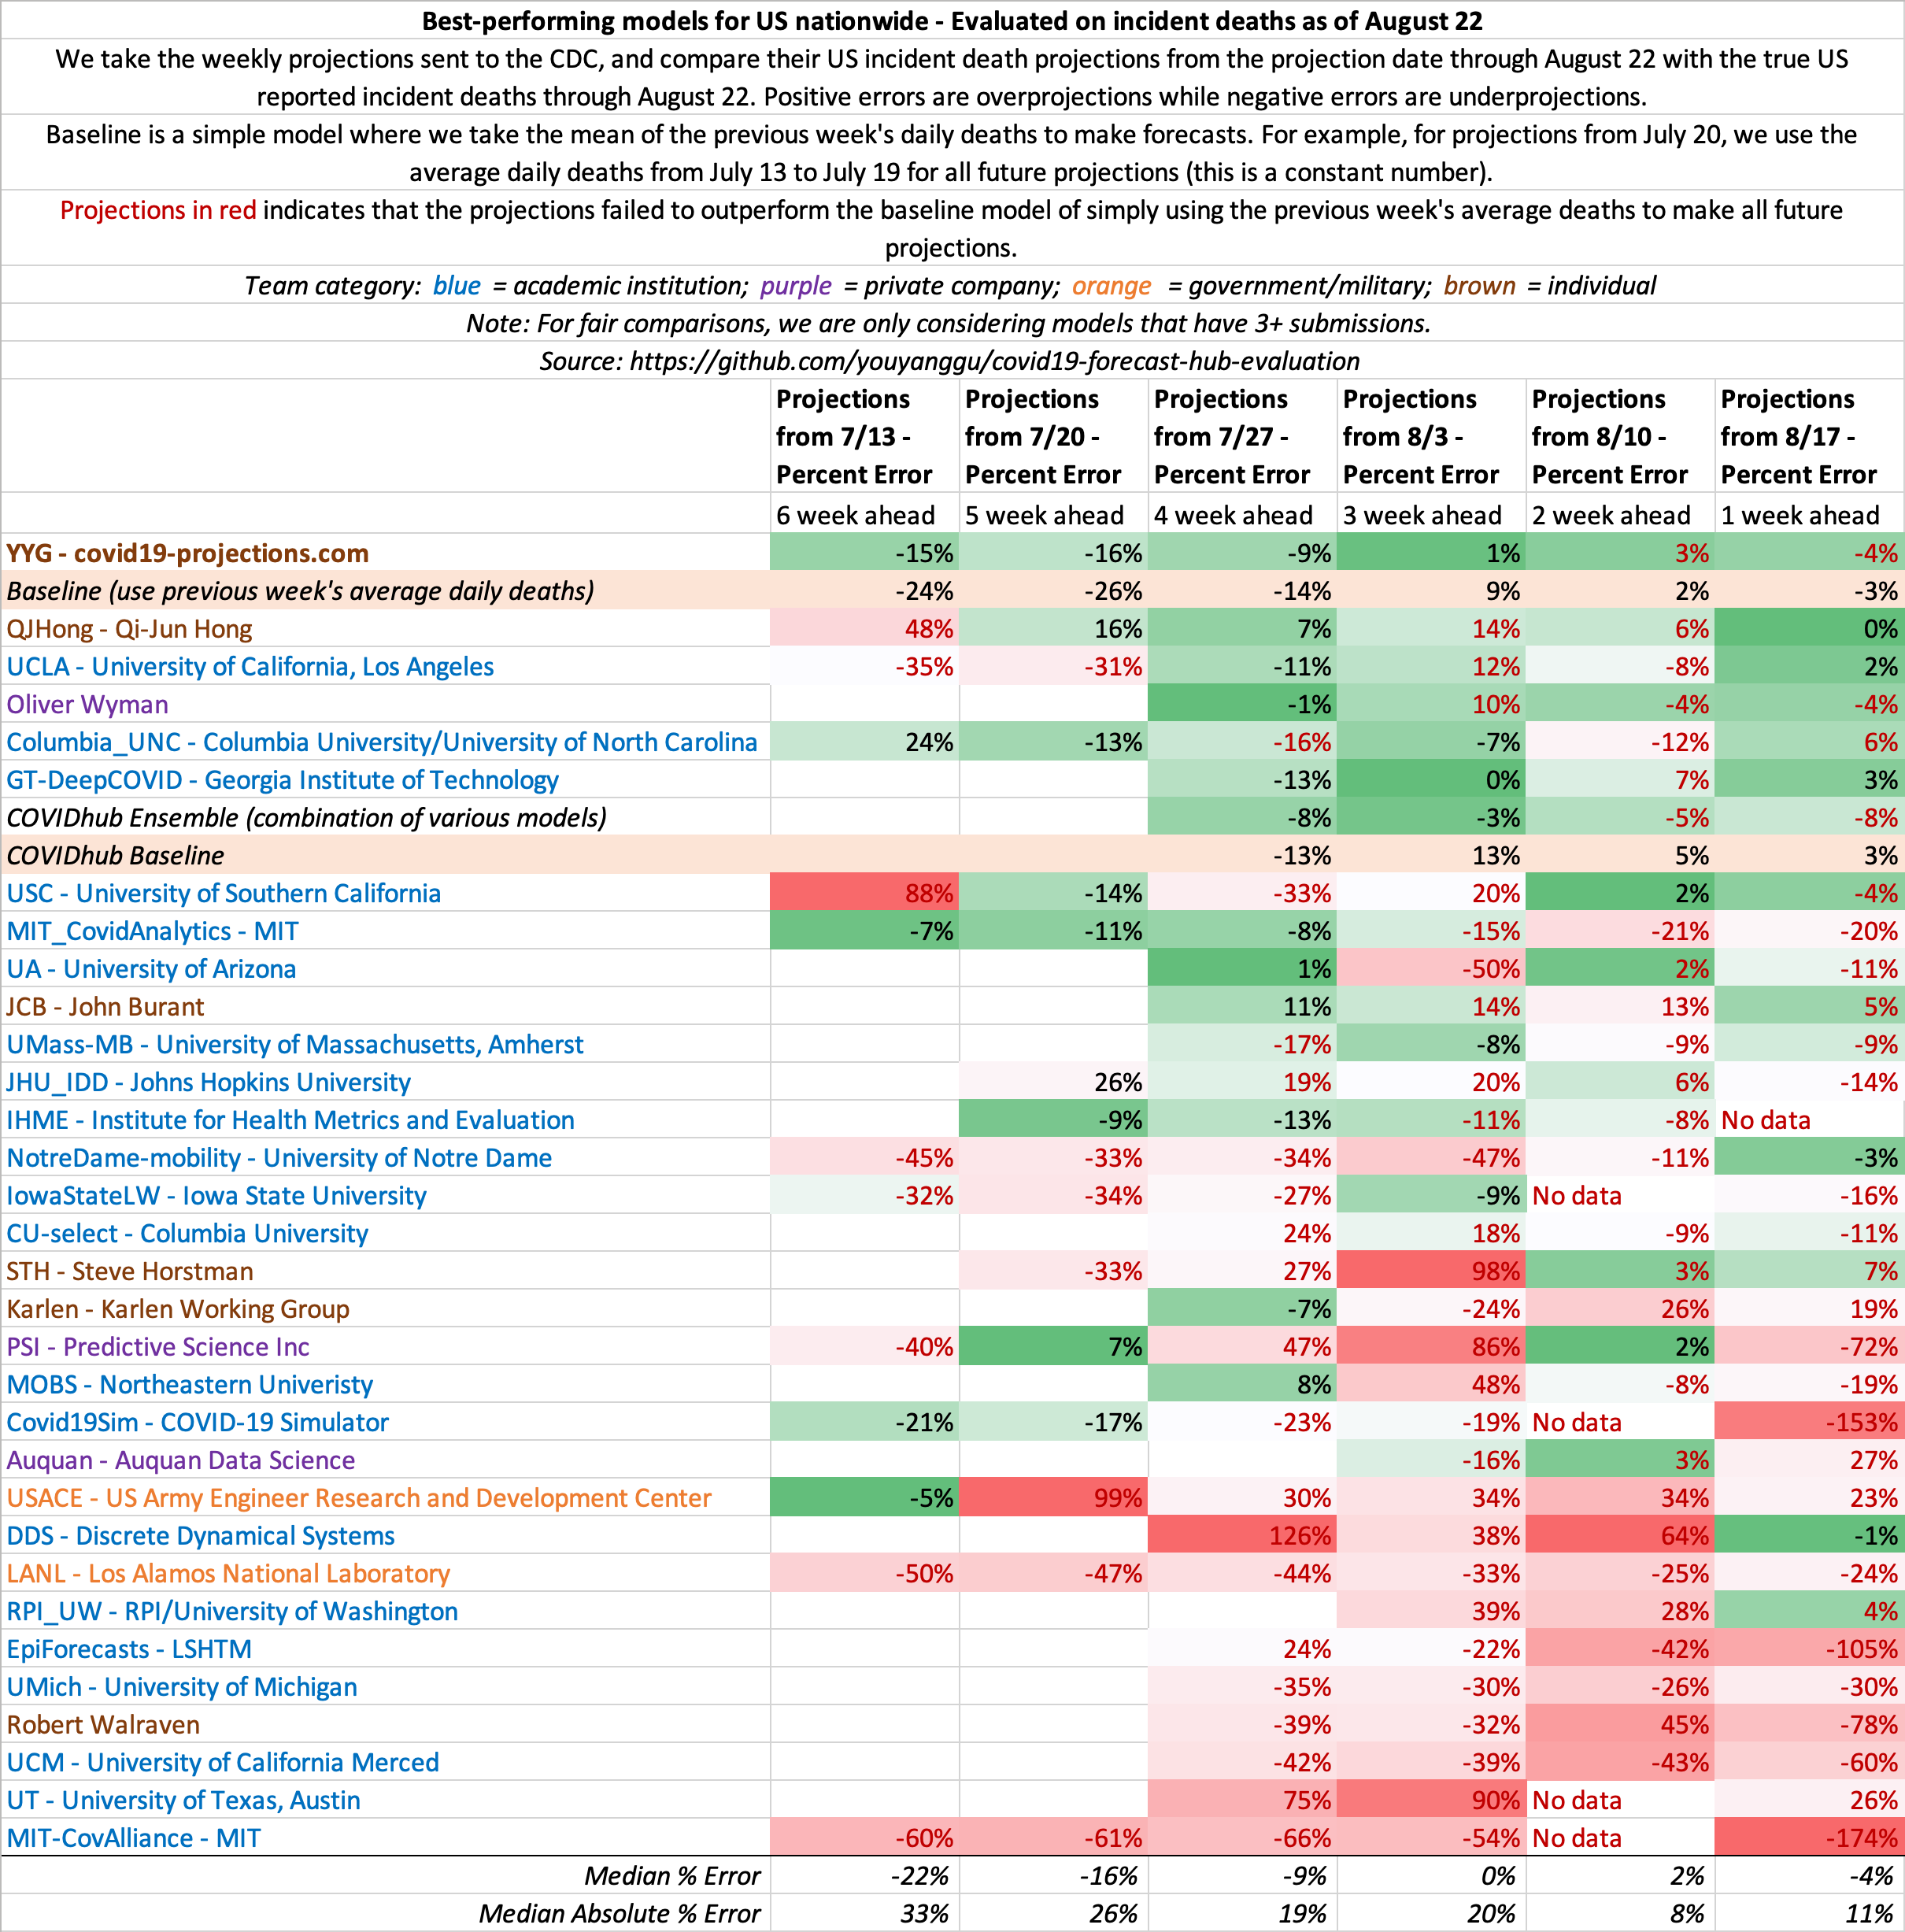
August 22
State-by-state projections
US projections
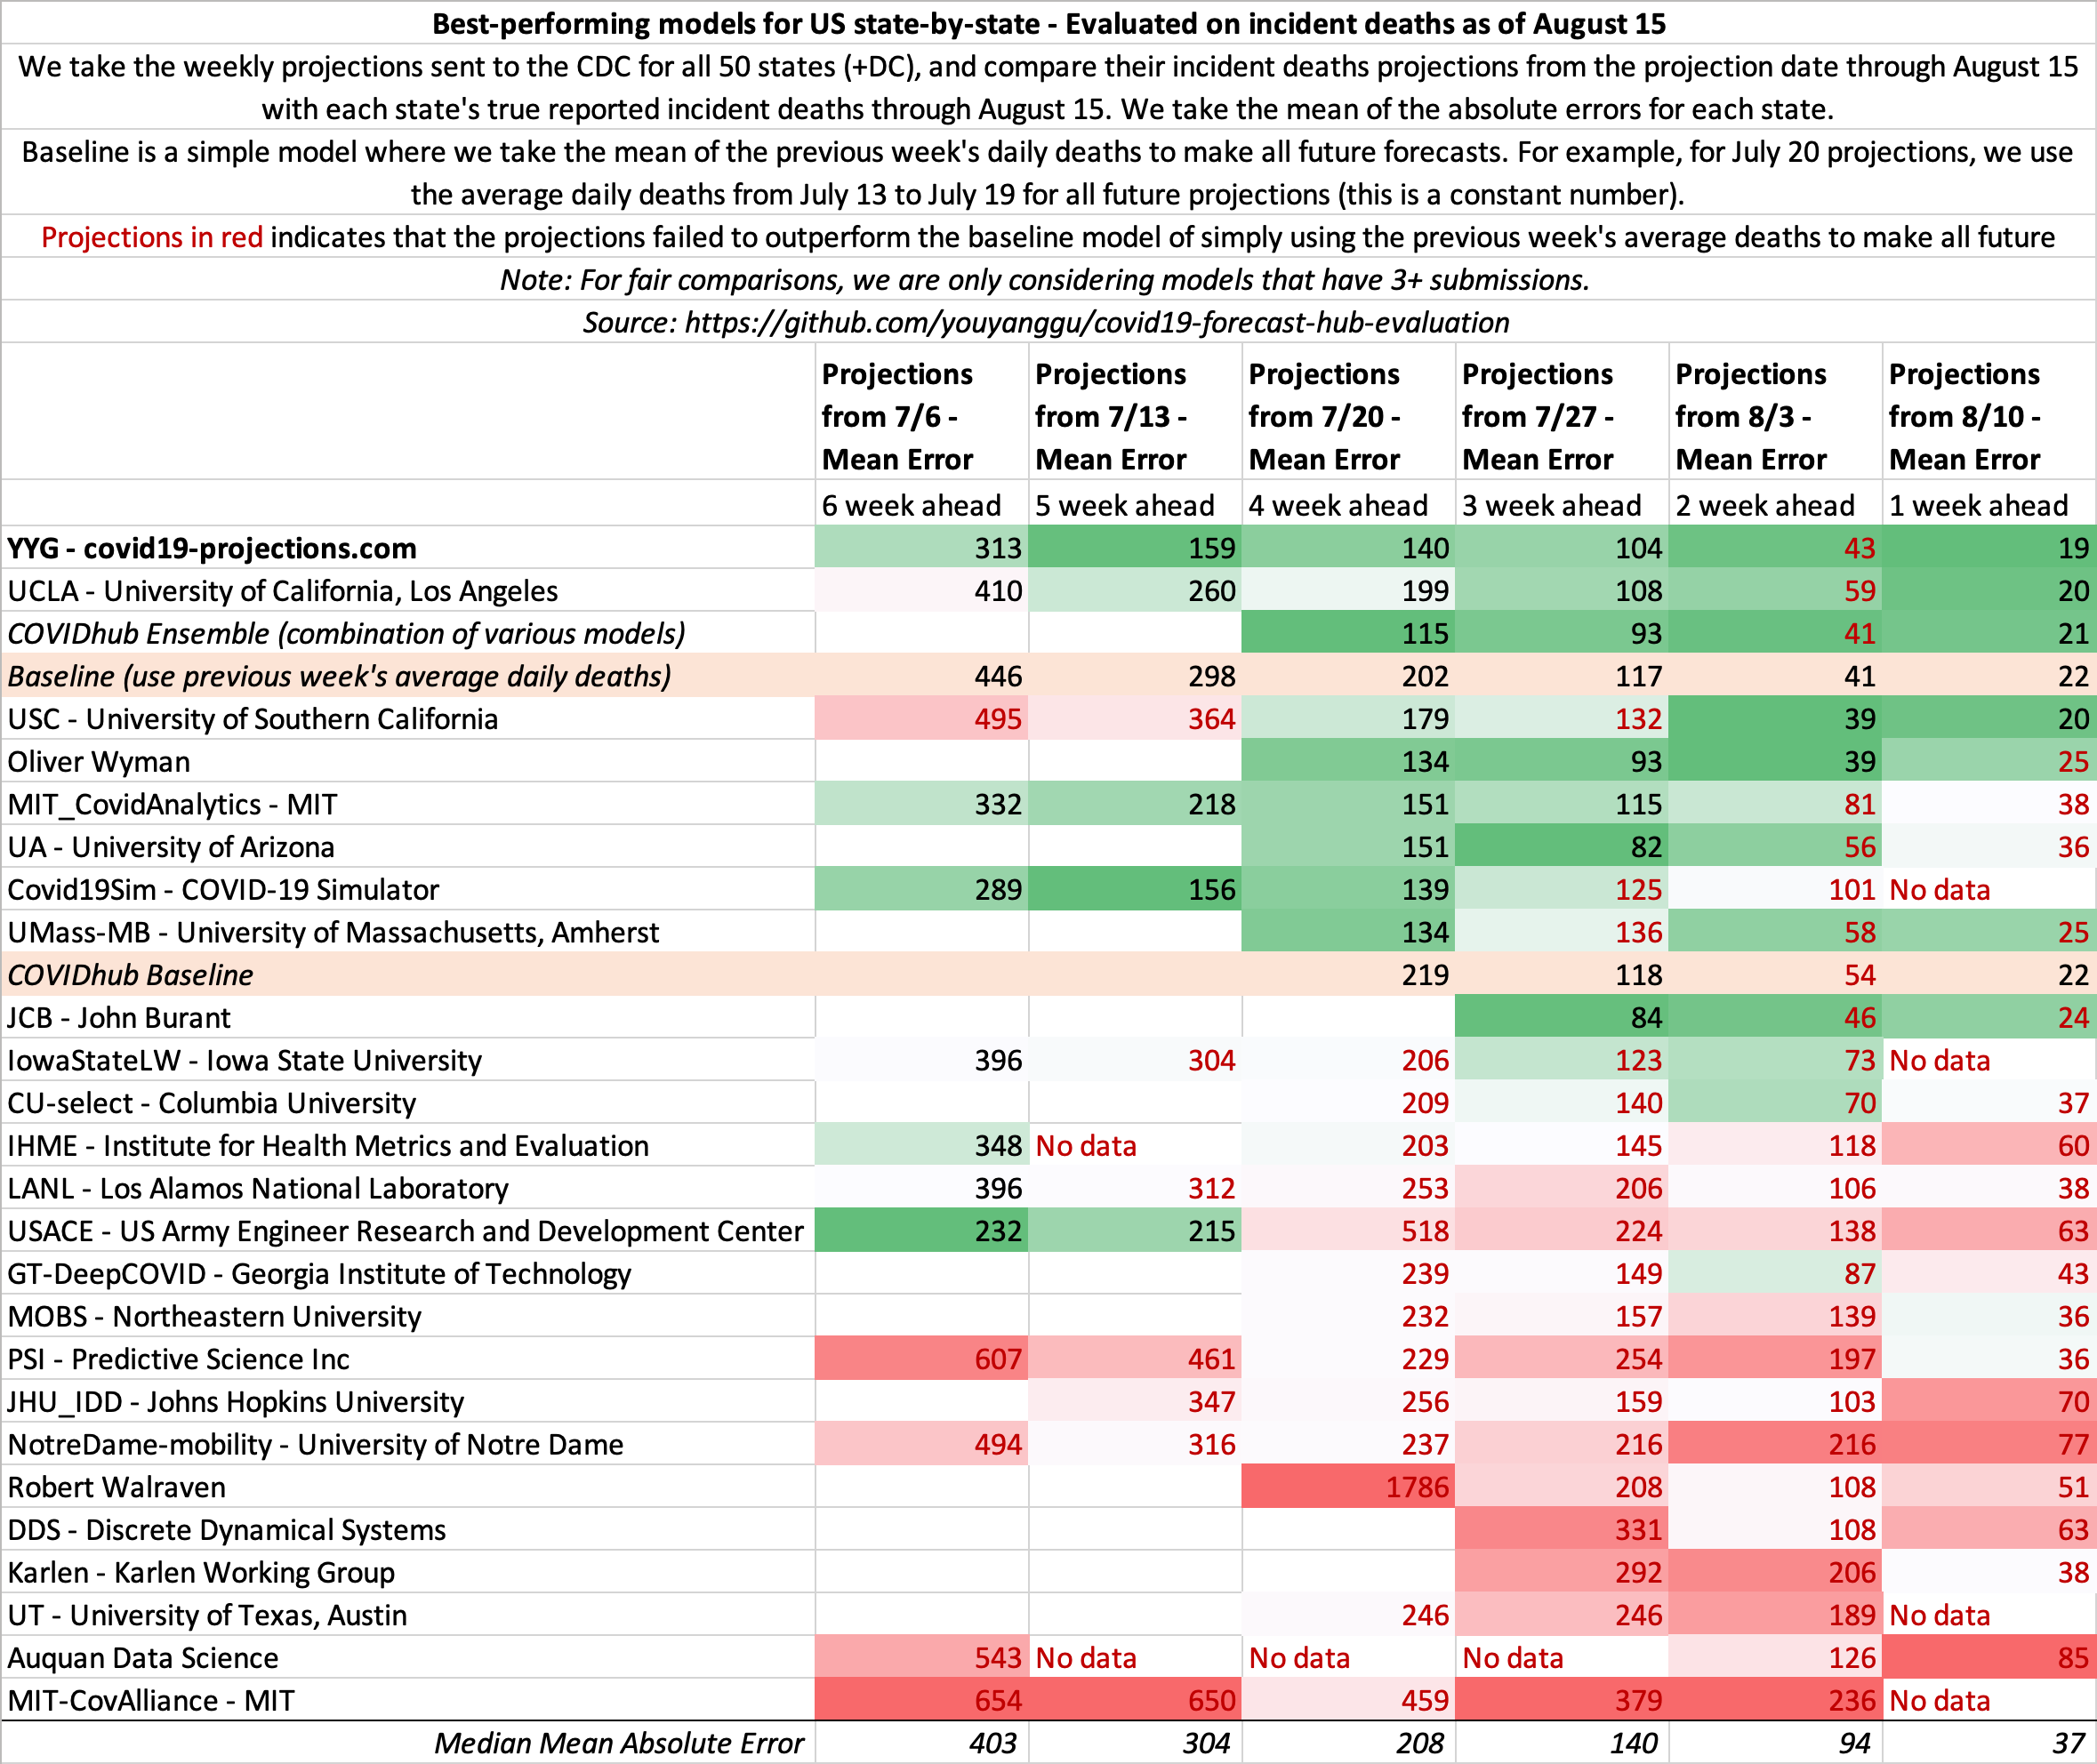
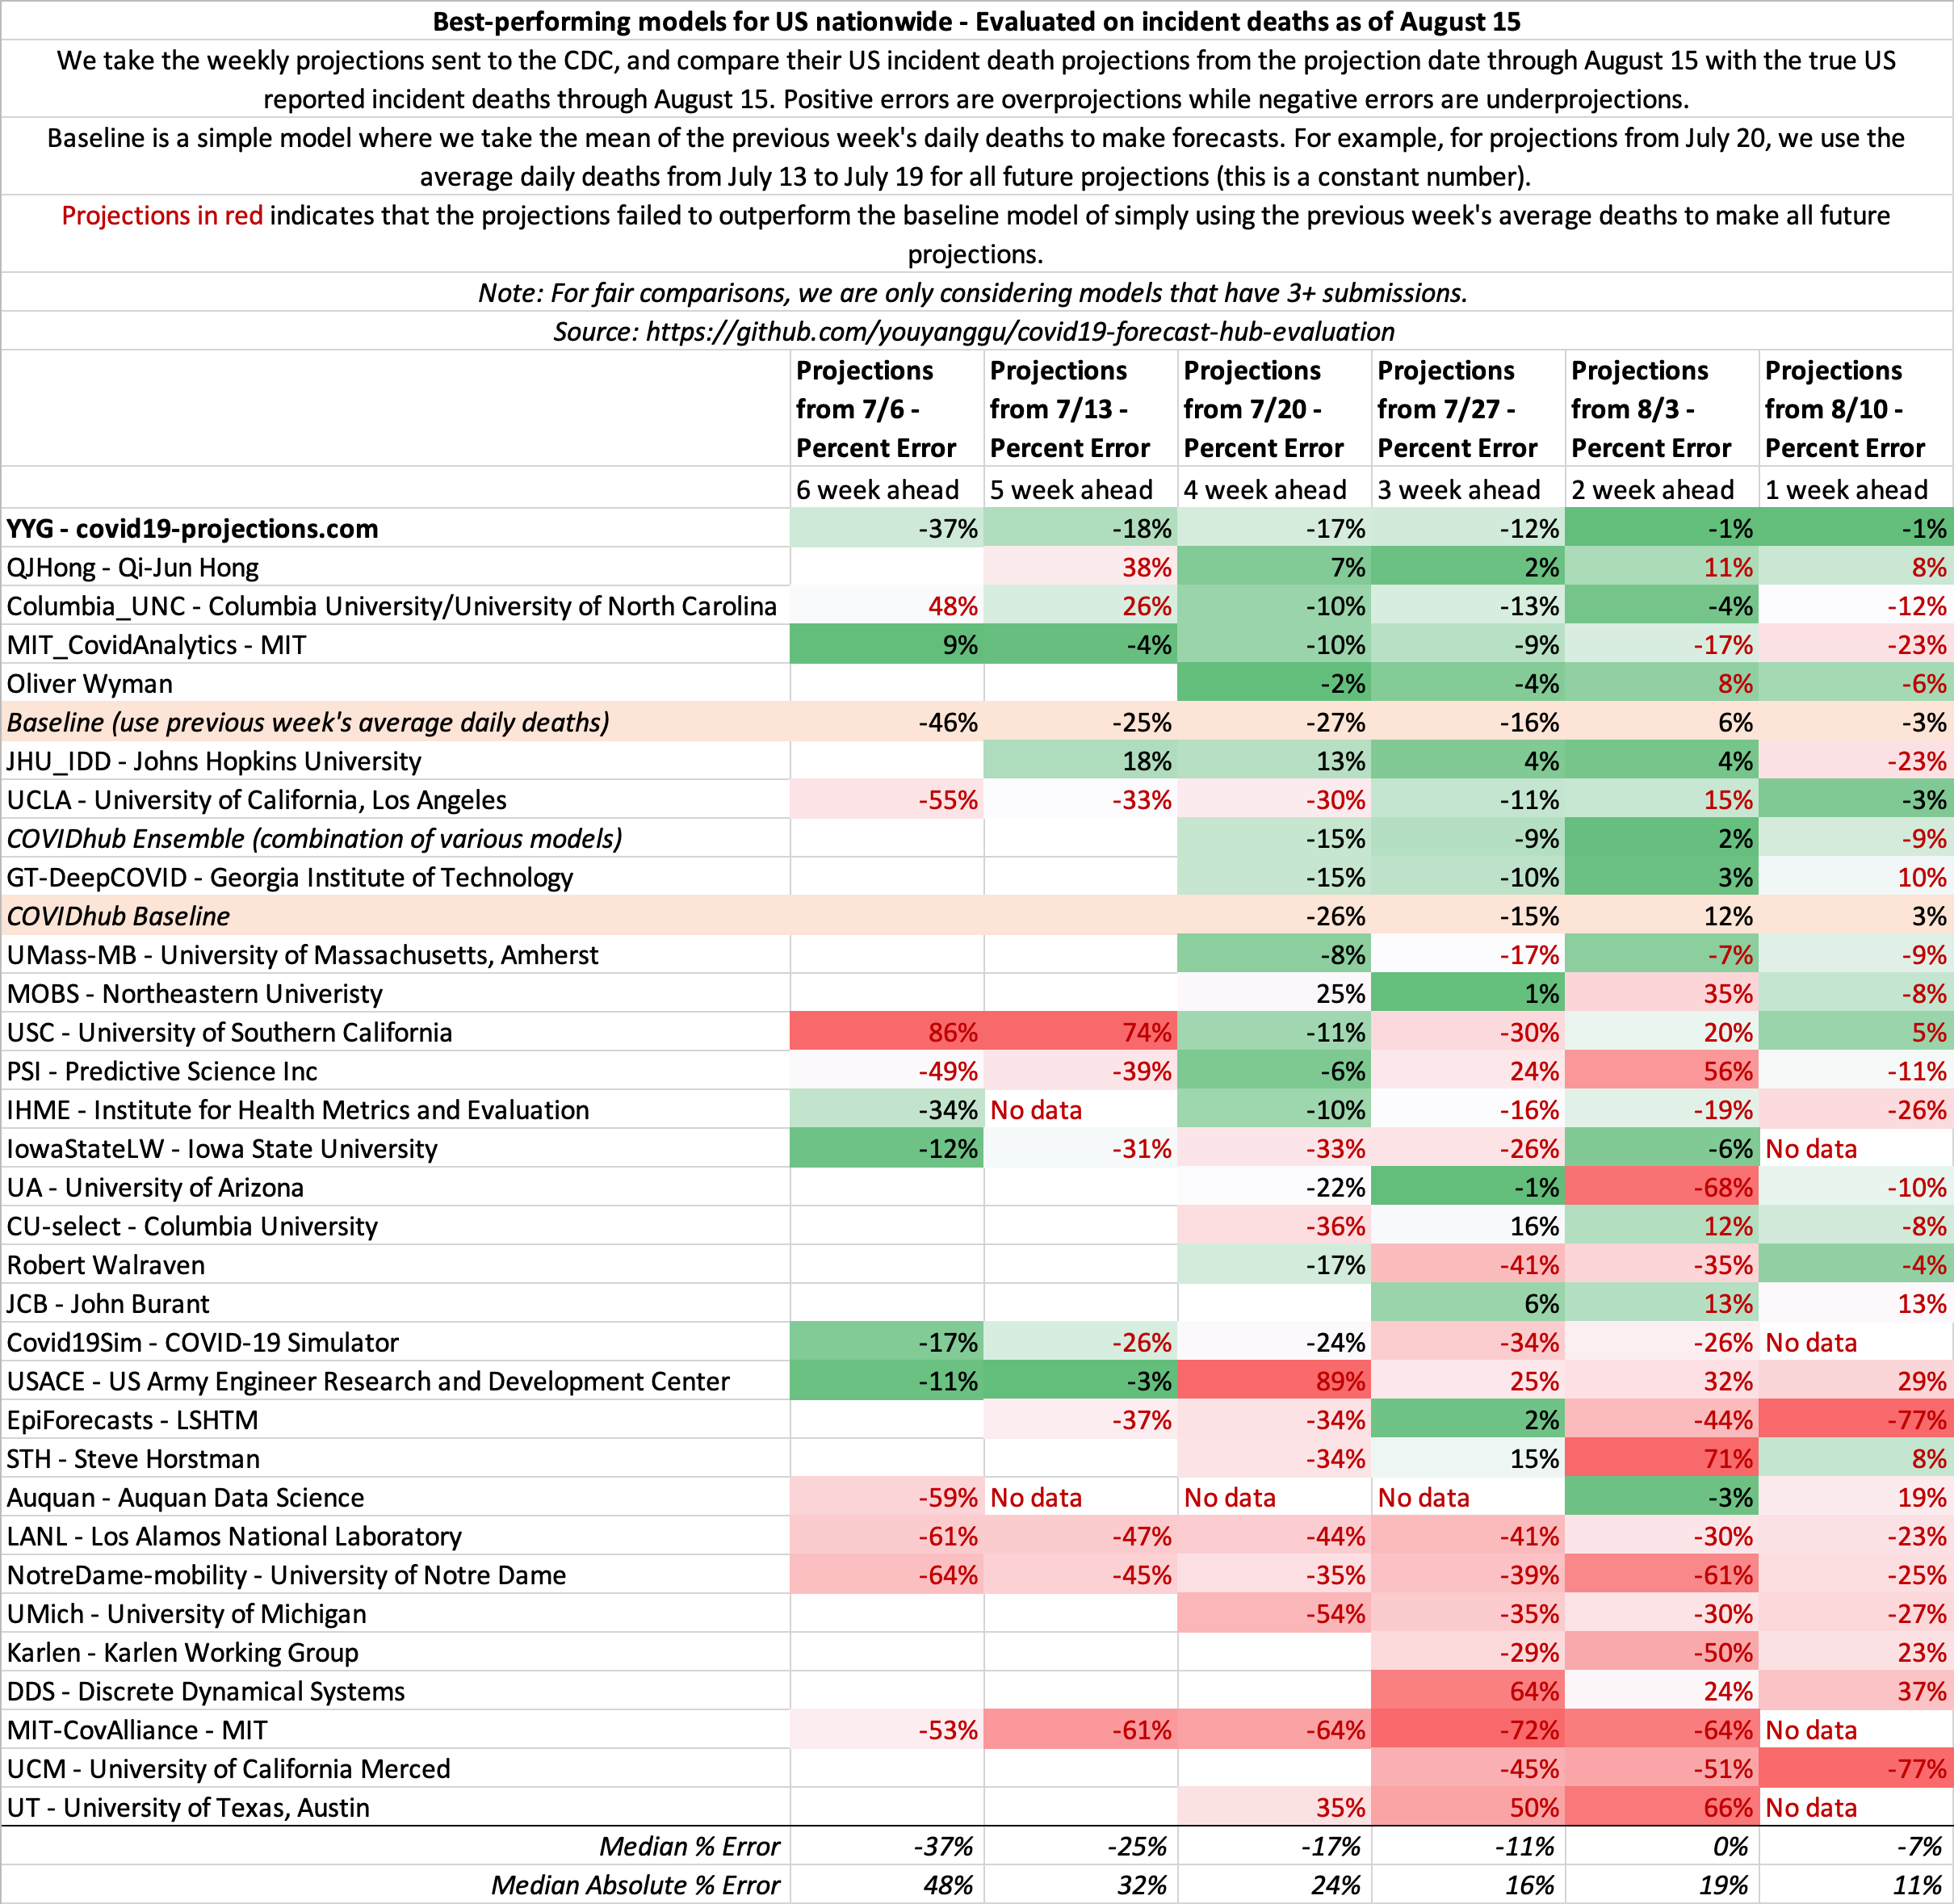
August 15
State-by-state projections
US projections
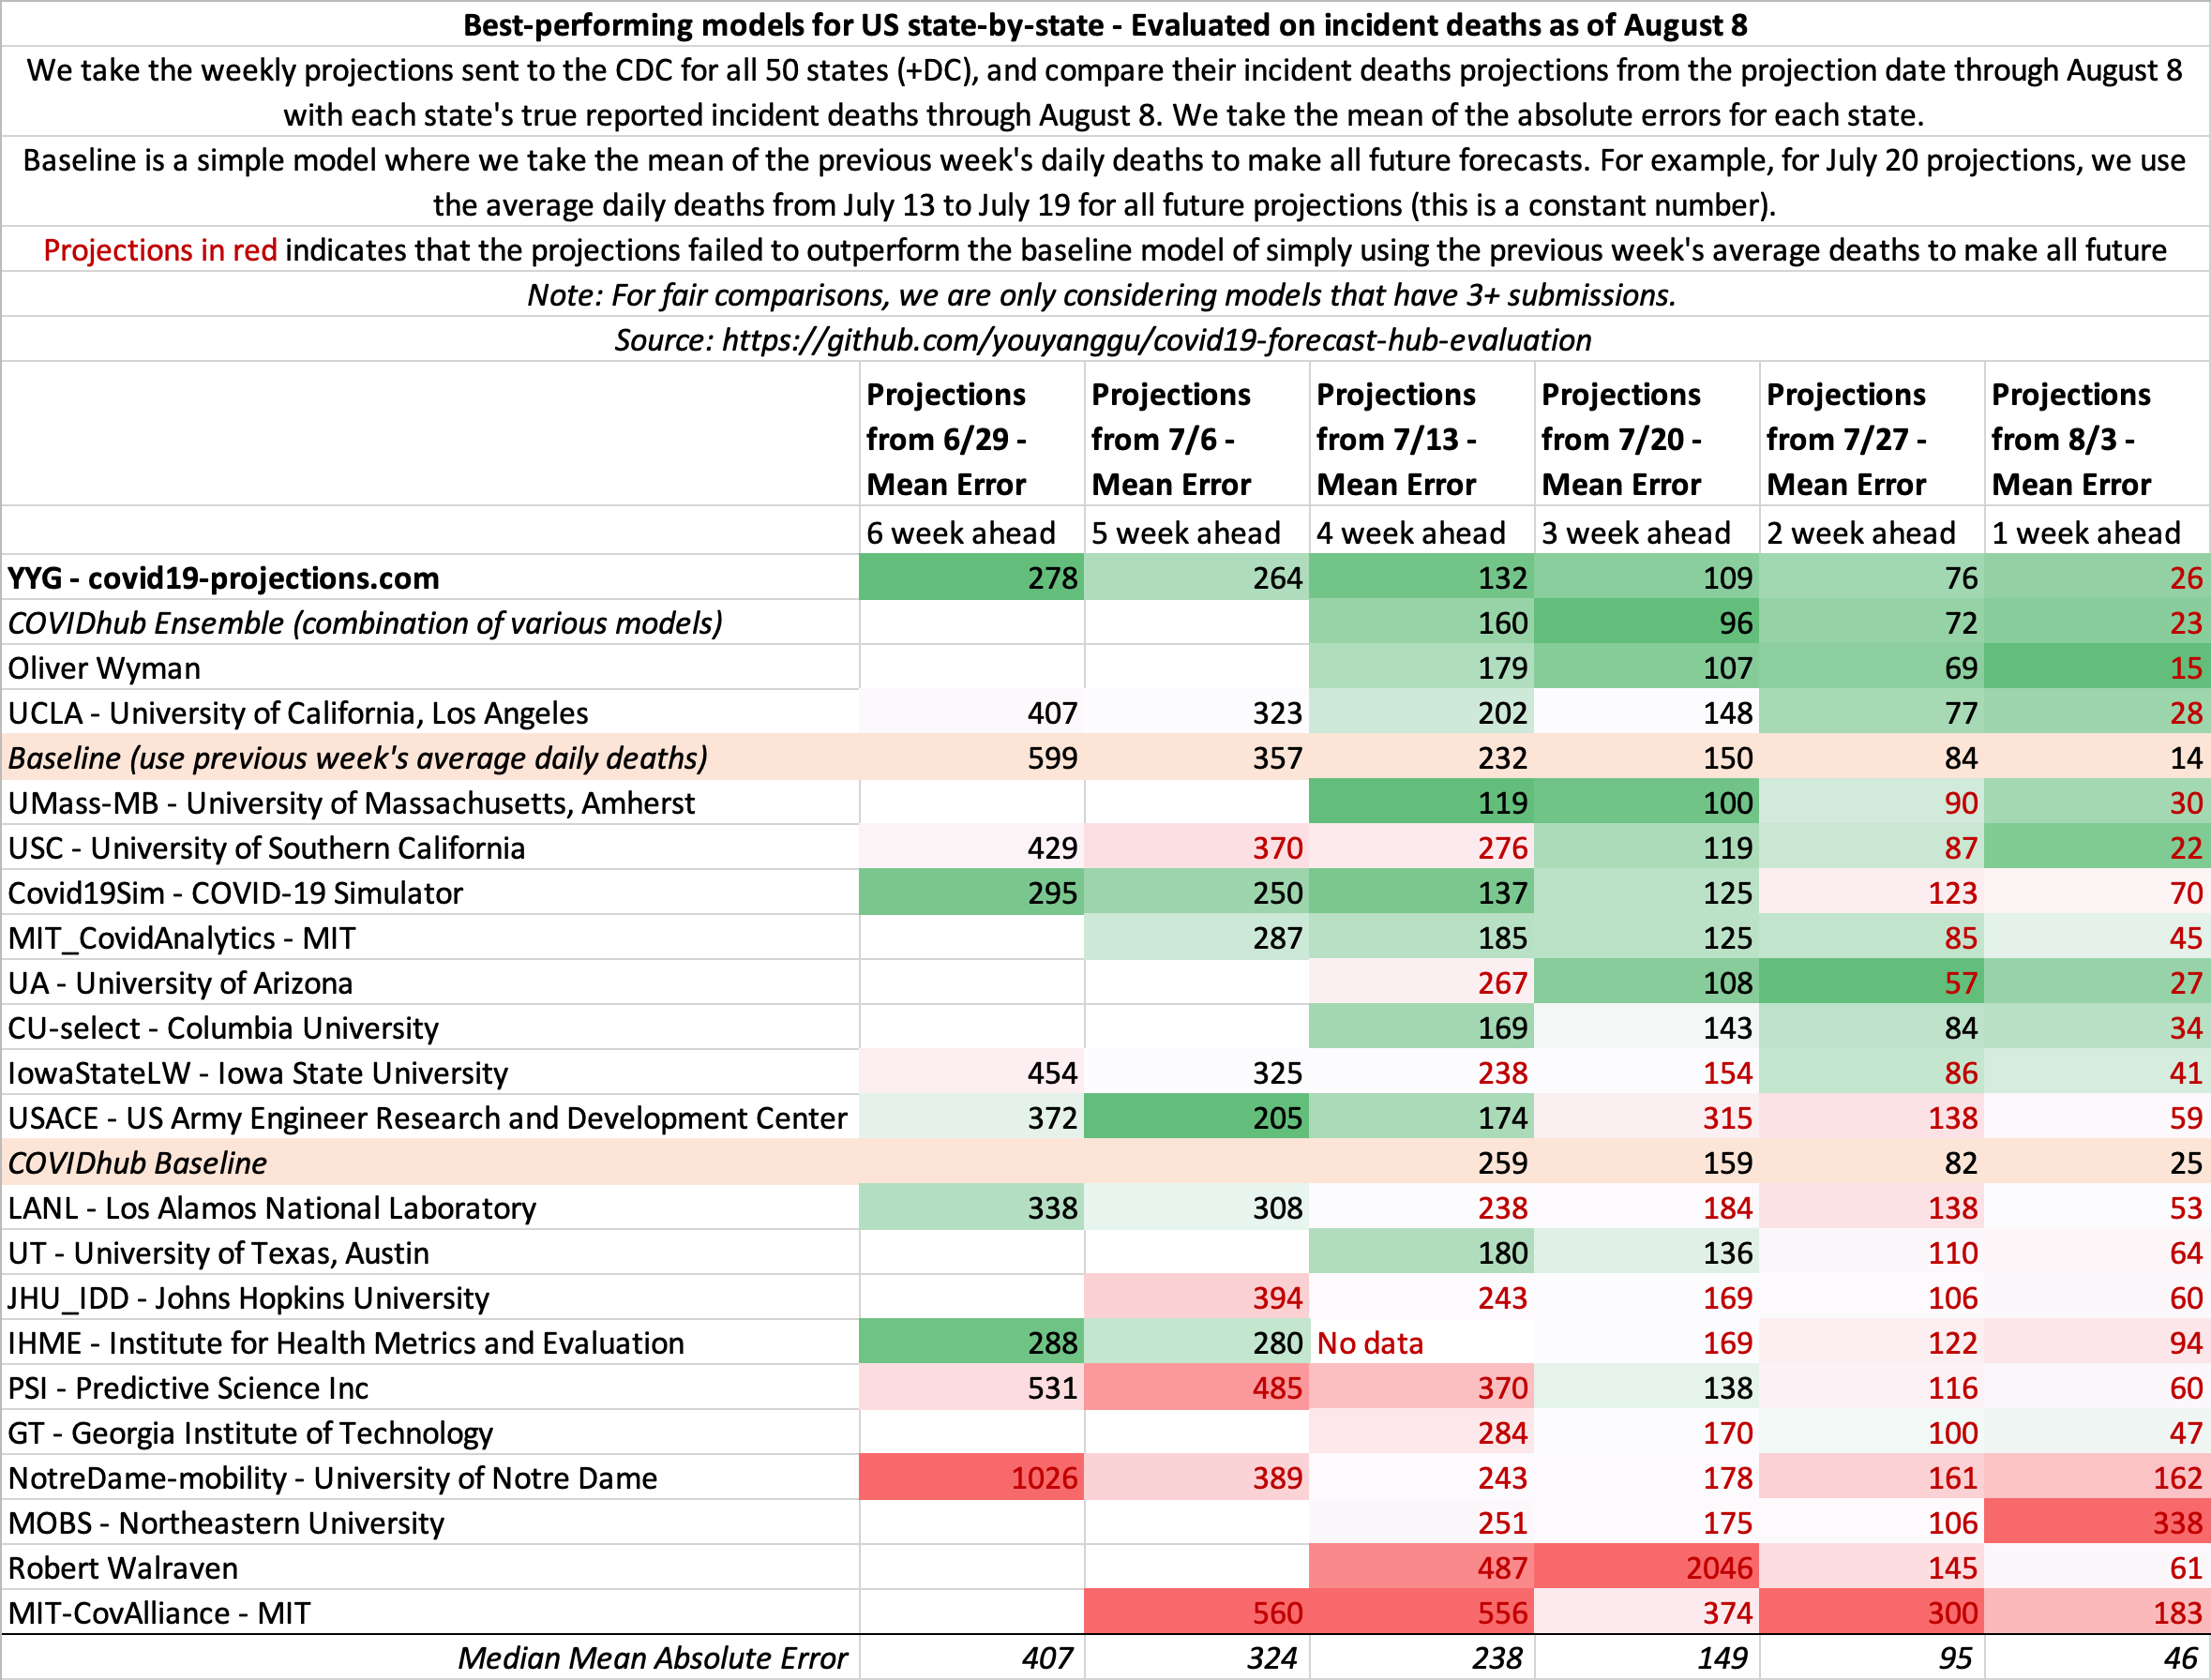
August 8
State-by-state projections
US projections
August 1
State-by-state projections
US projections
July 25
State-by-state projections
US projections
July 18
State-by-state projections
US projections
July 11
State-by-state projections
US projections
July 4
State-by-state projections
US projections
June 27
State-by-state projections
US projections
June 20
State-by-state projections

US projections
June 13
State-by-state projections
US projections
June 6
State-by-state projections
US projections
May 30
State-by-state projections
US projections
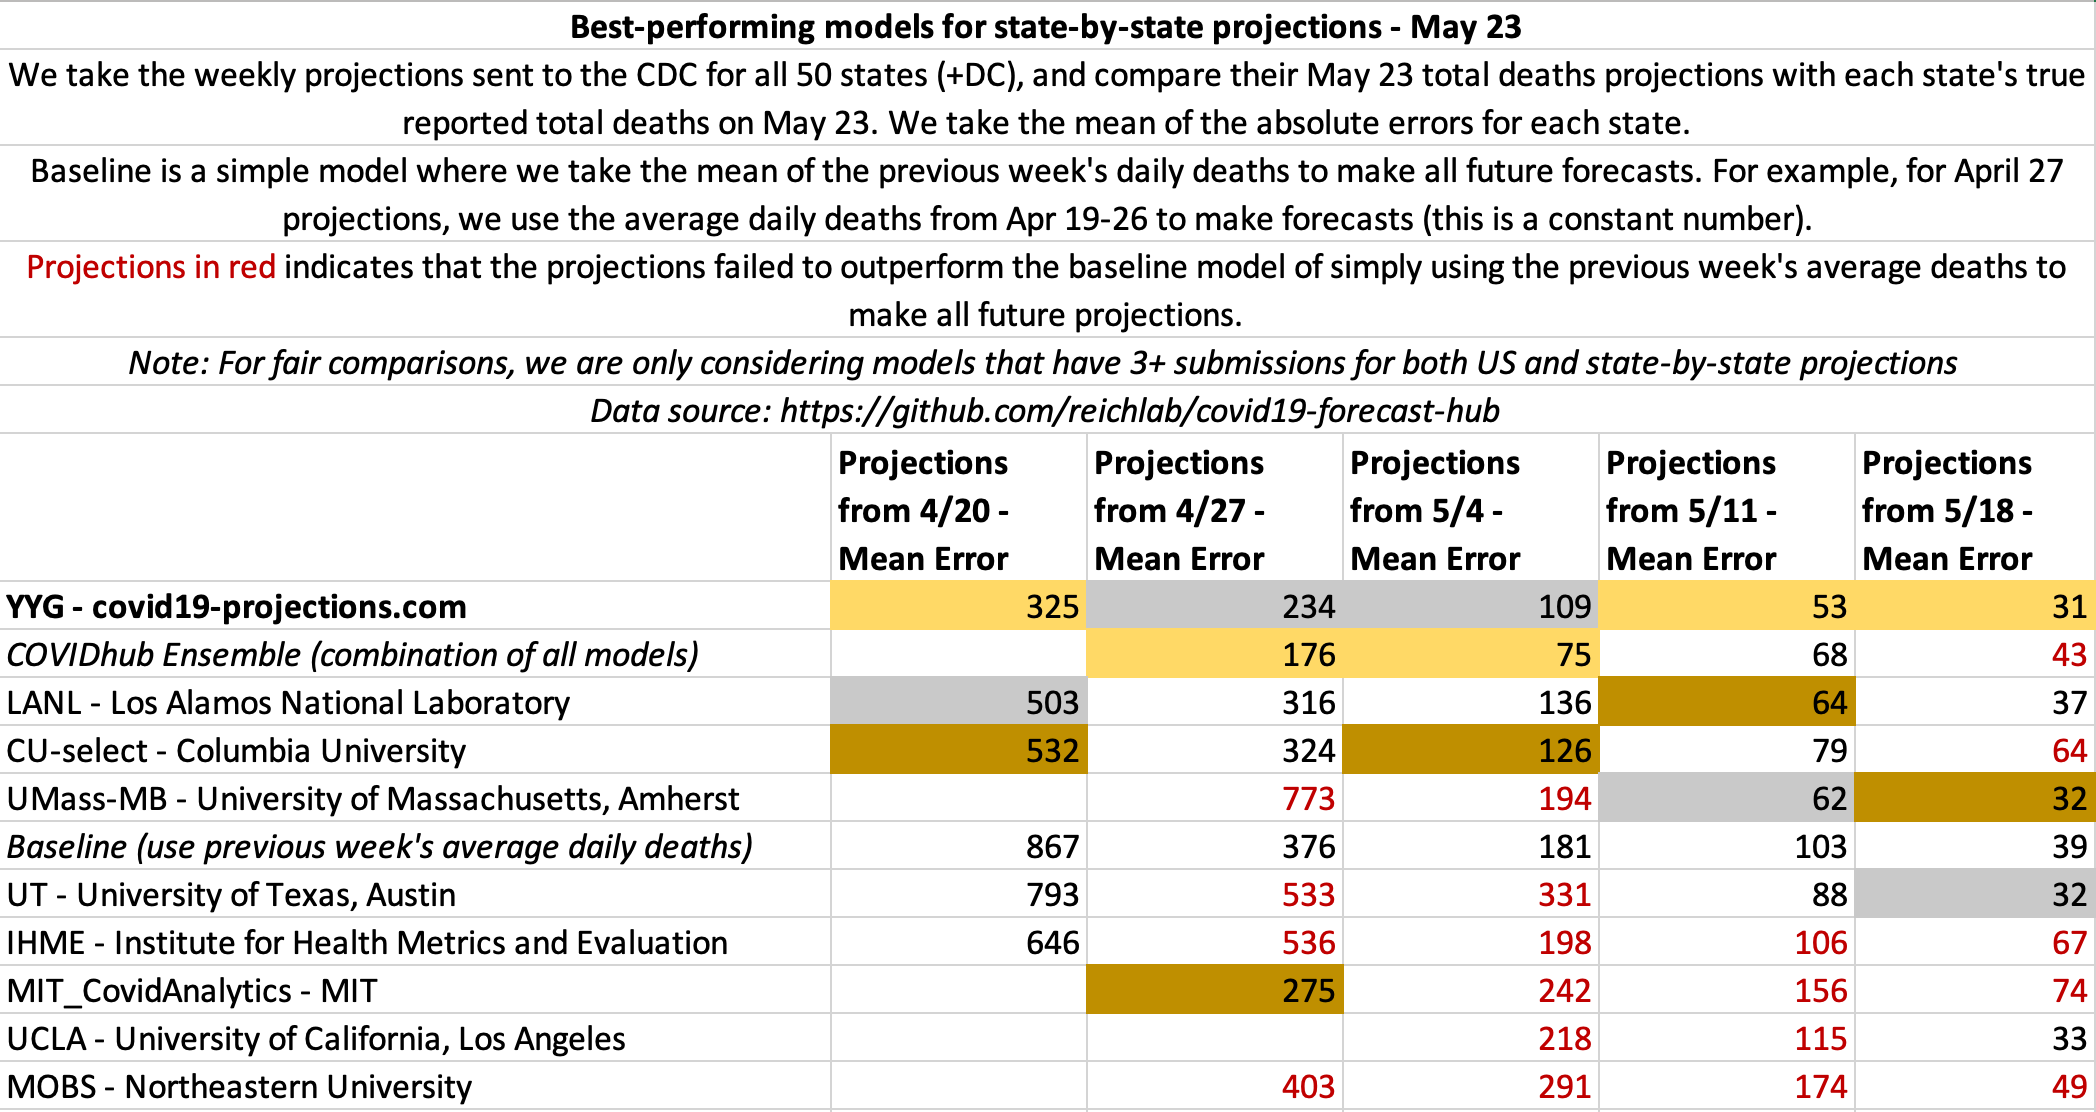
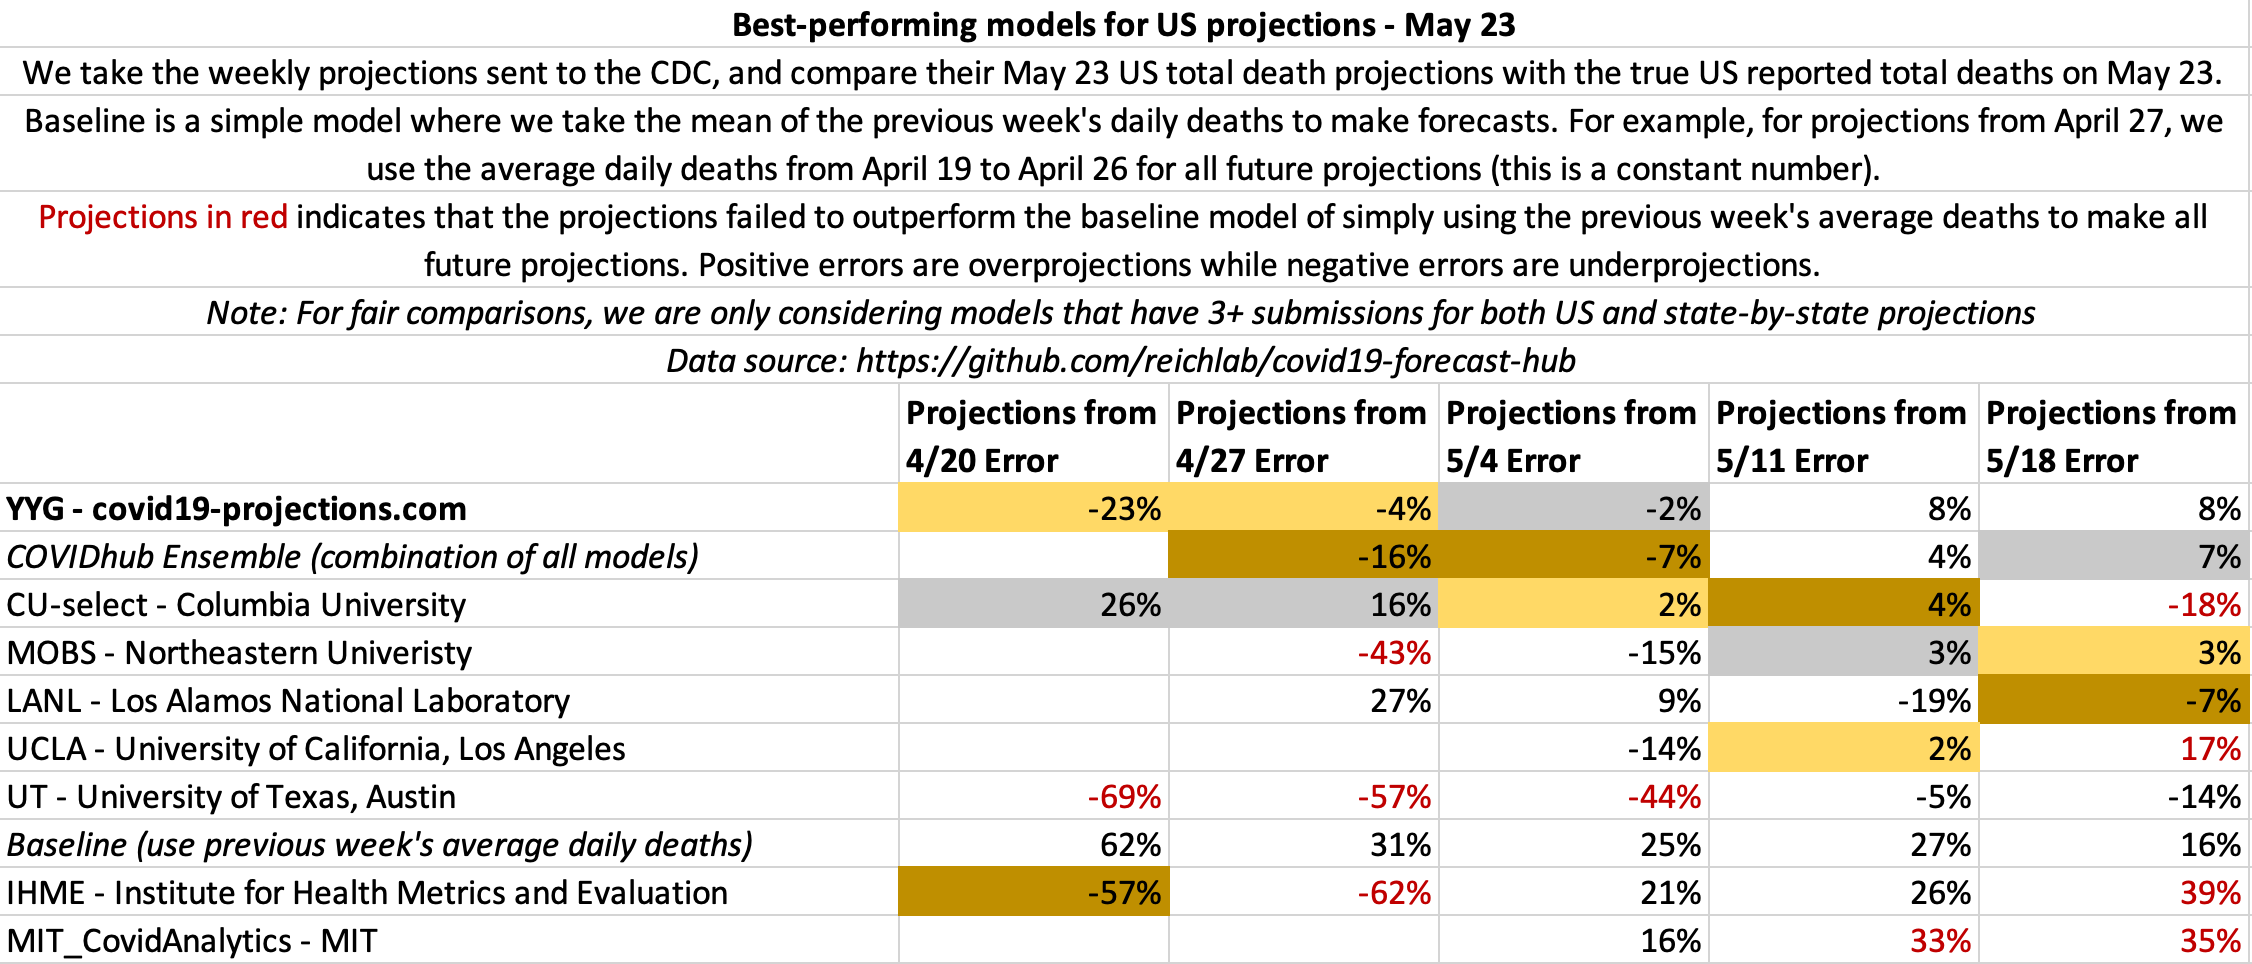
May 23
State-by-state projections
US projections
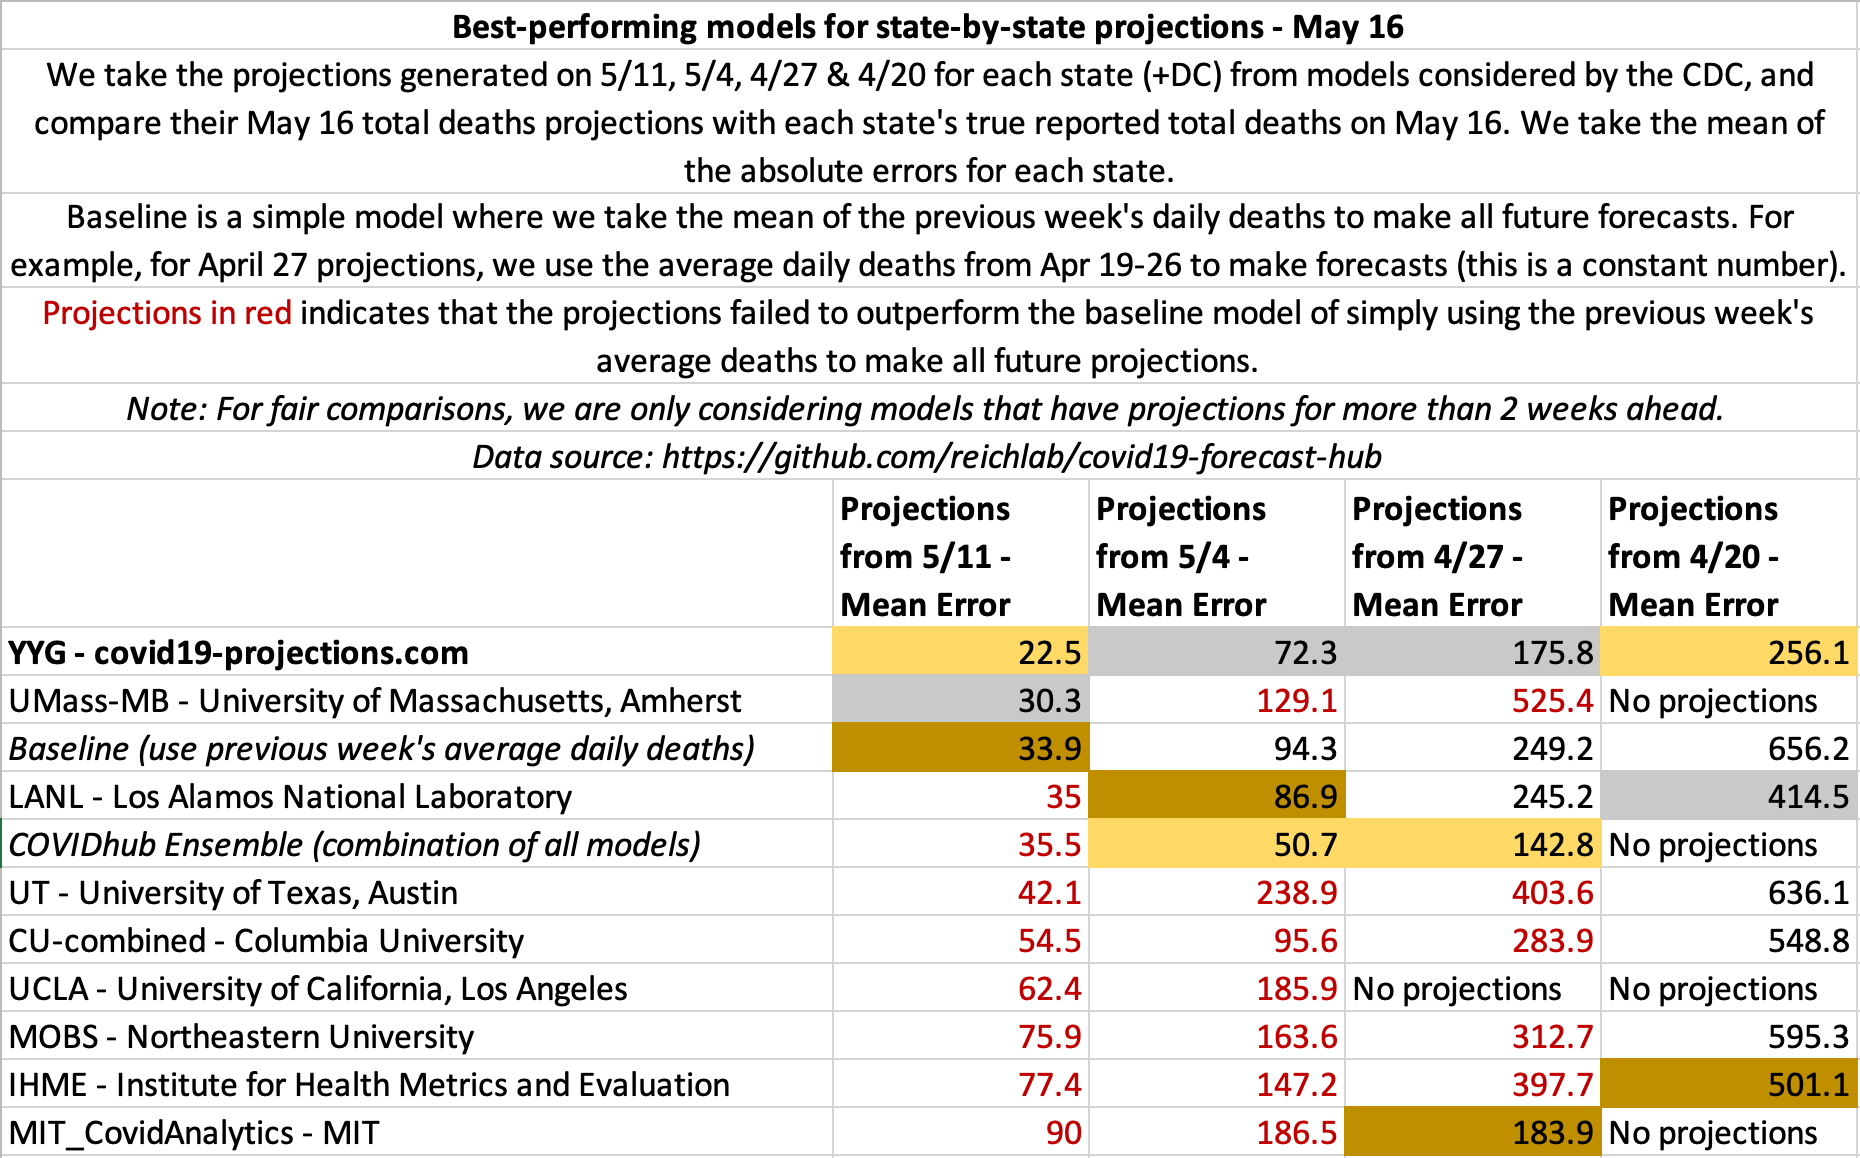
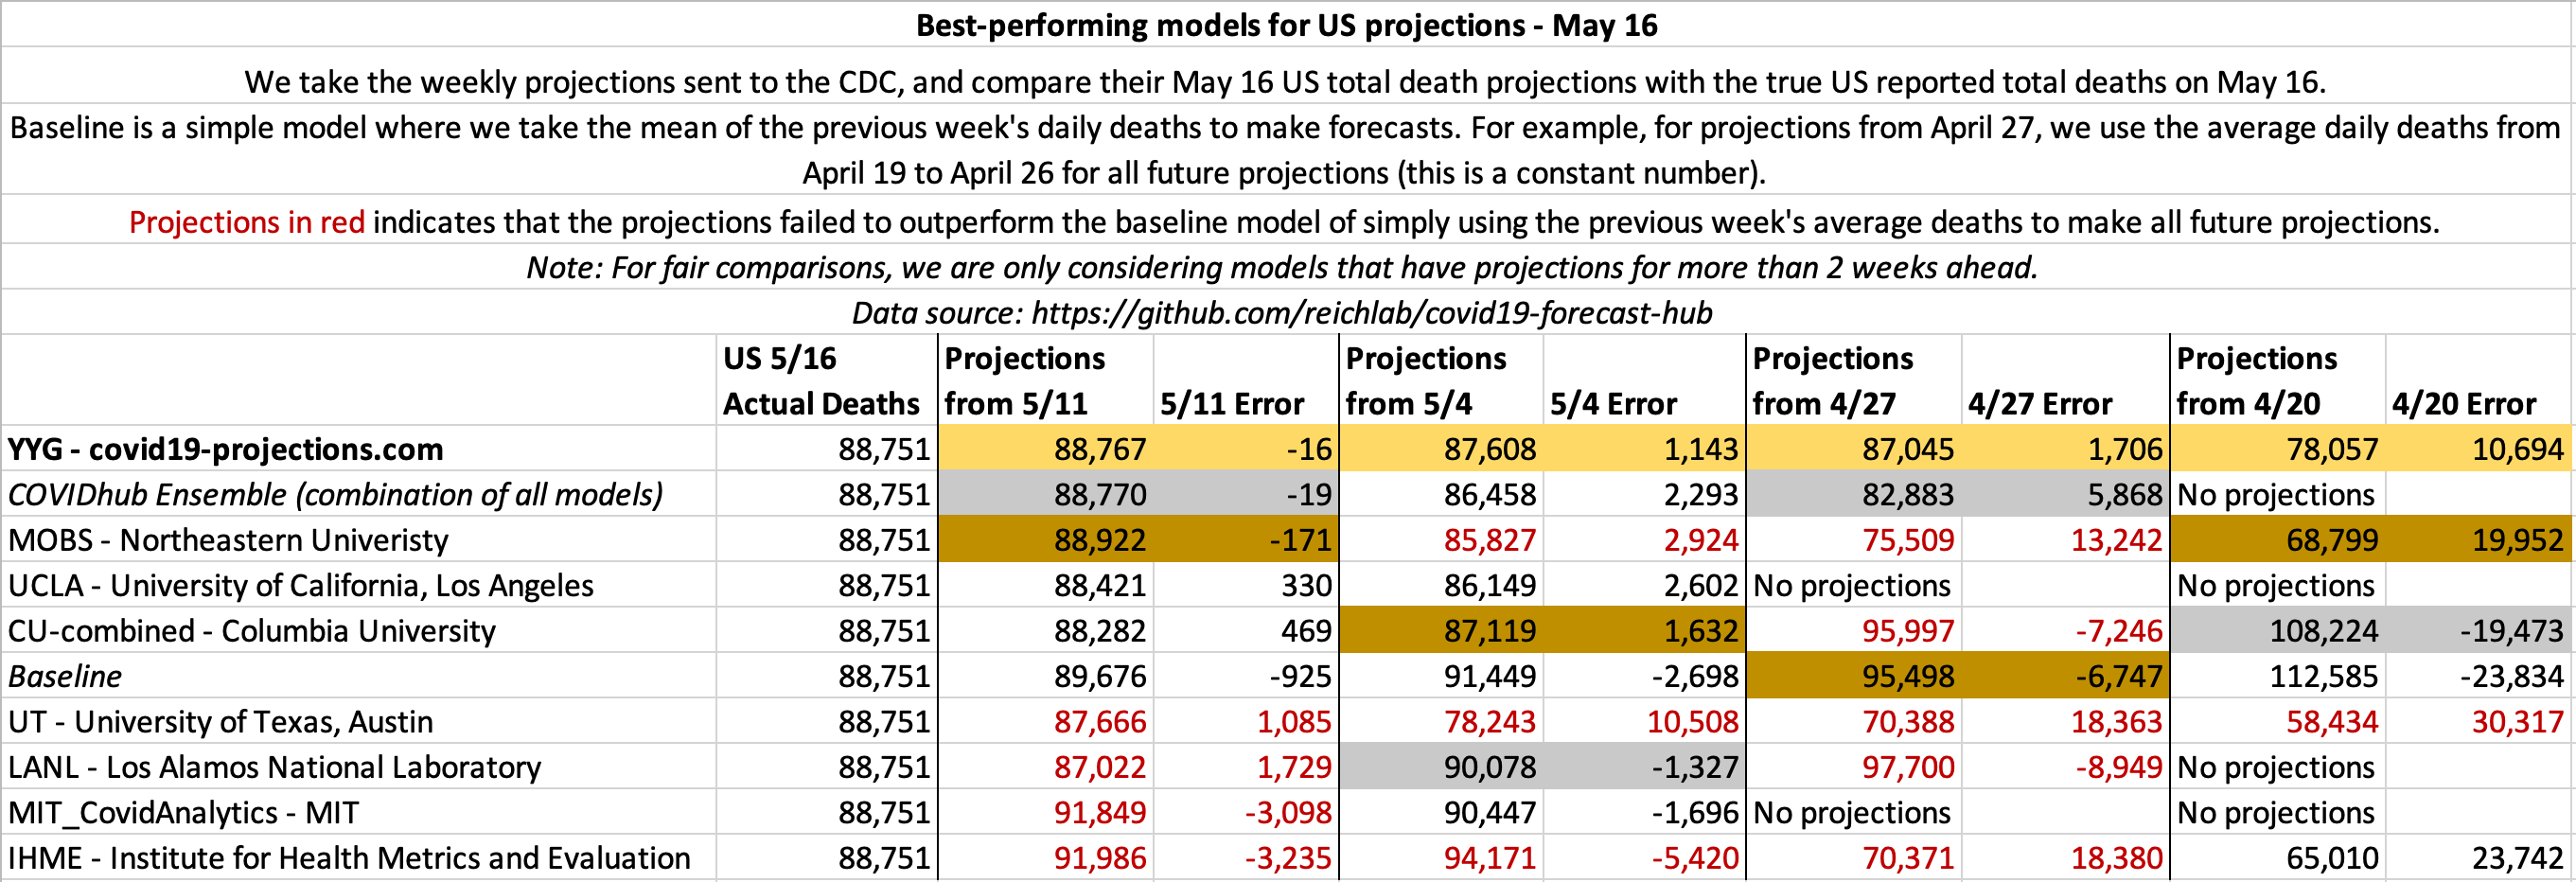
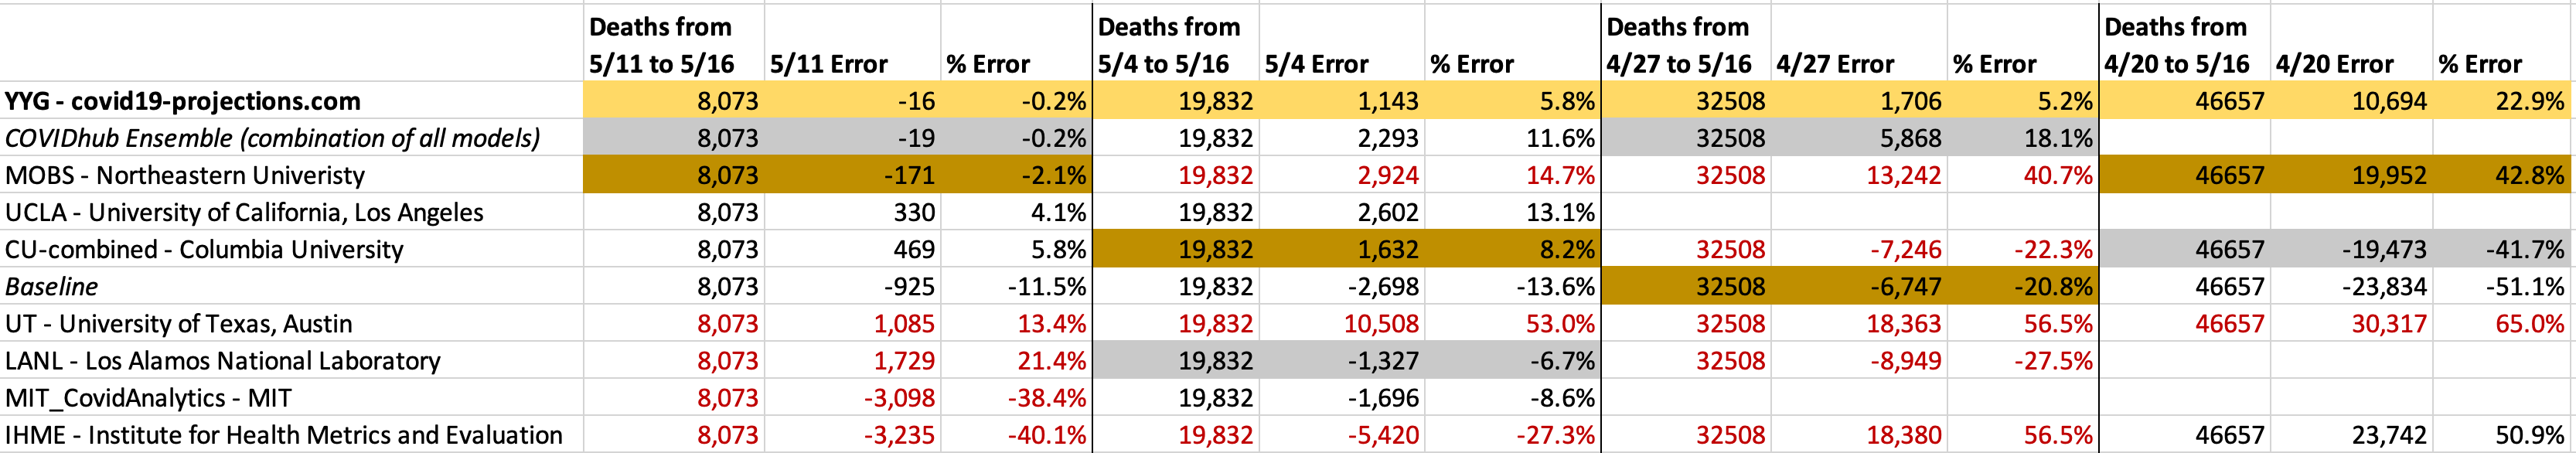
May 16
State-by-state projections
US projections
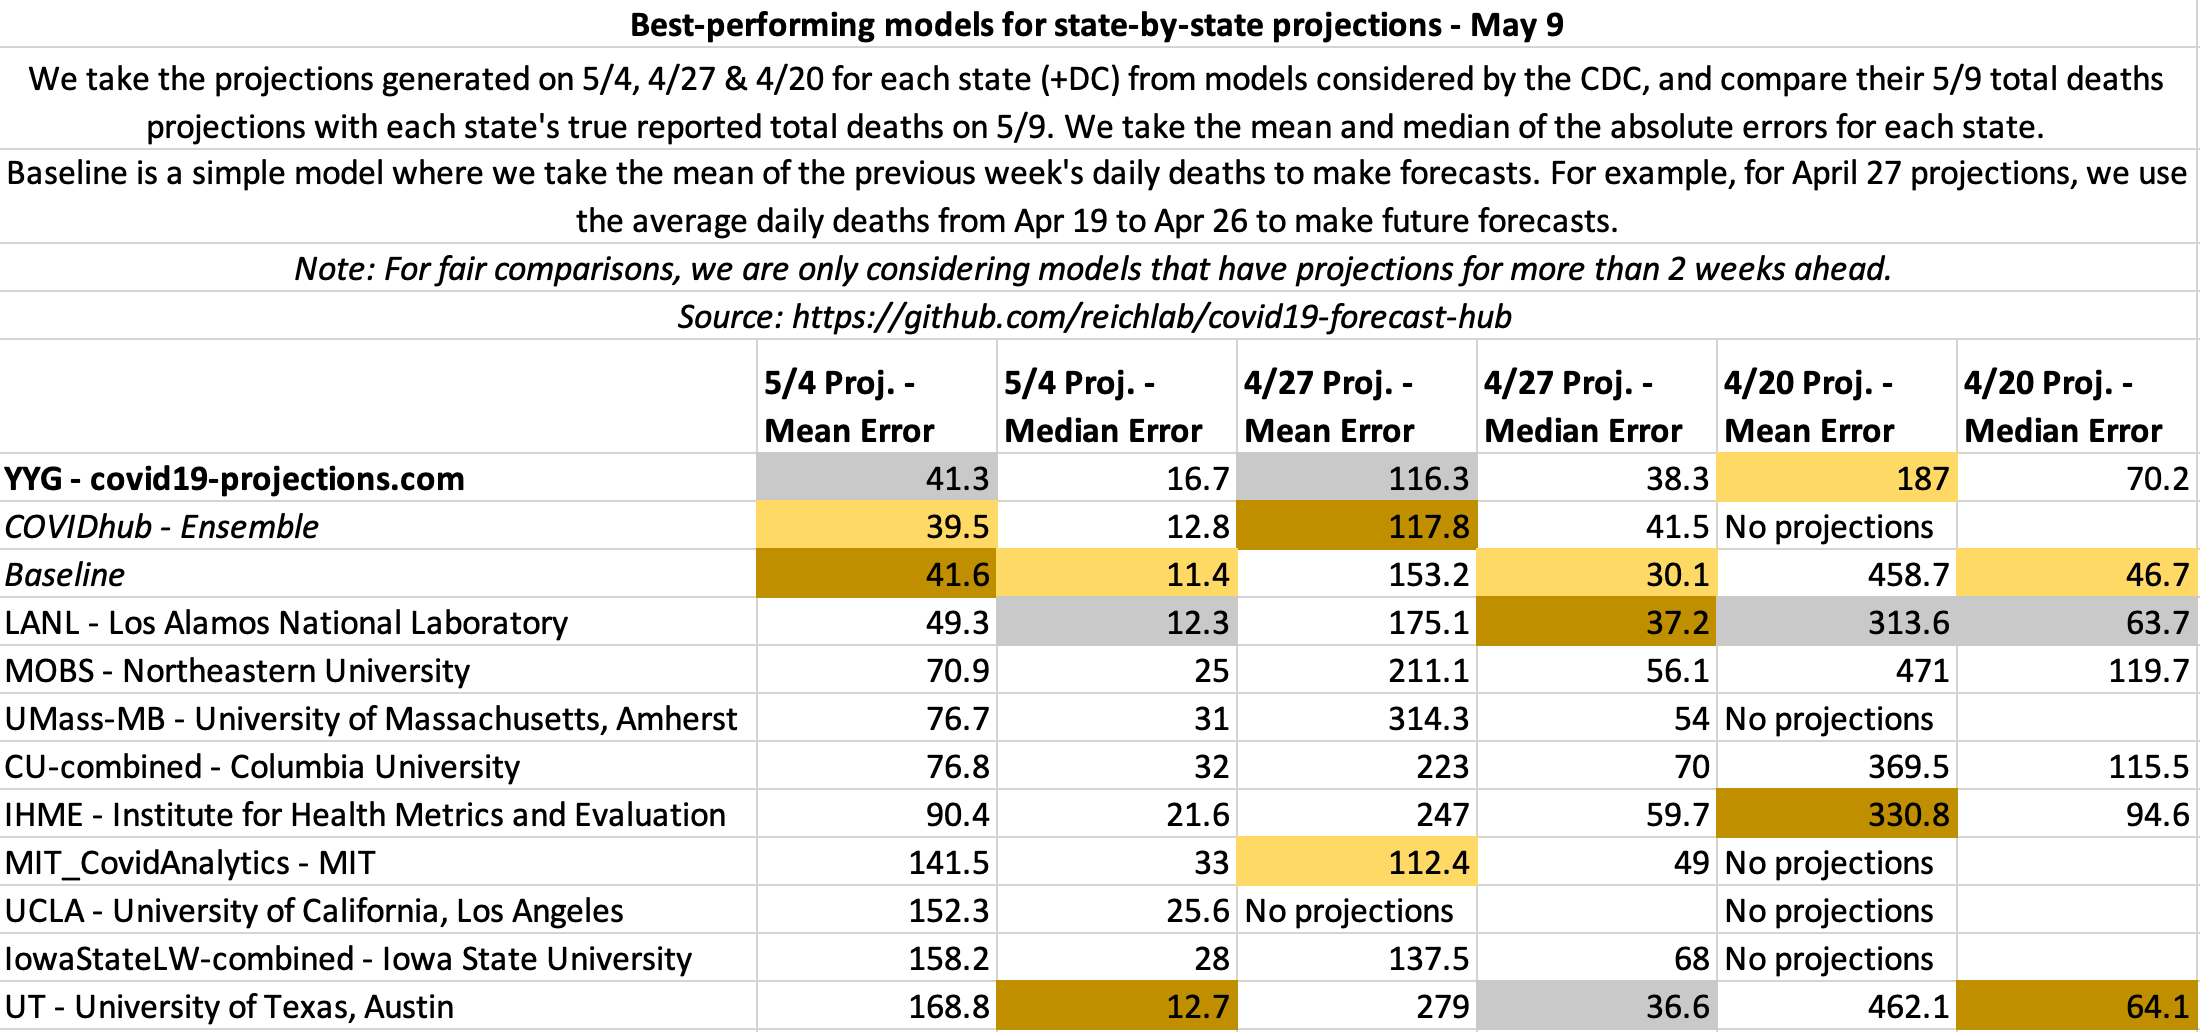
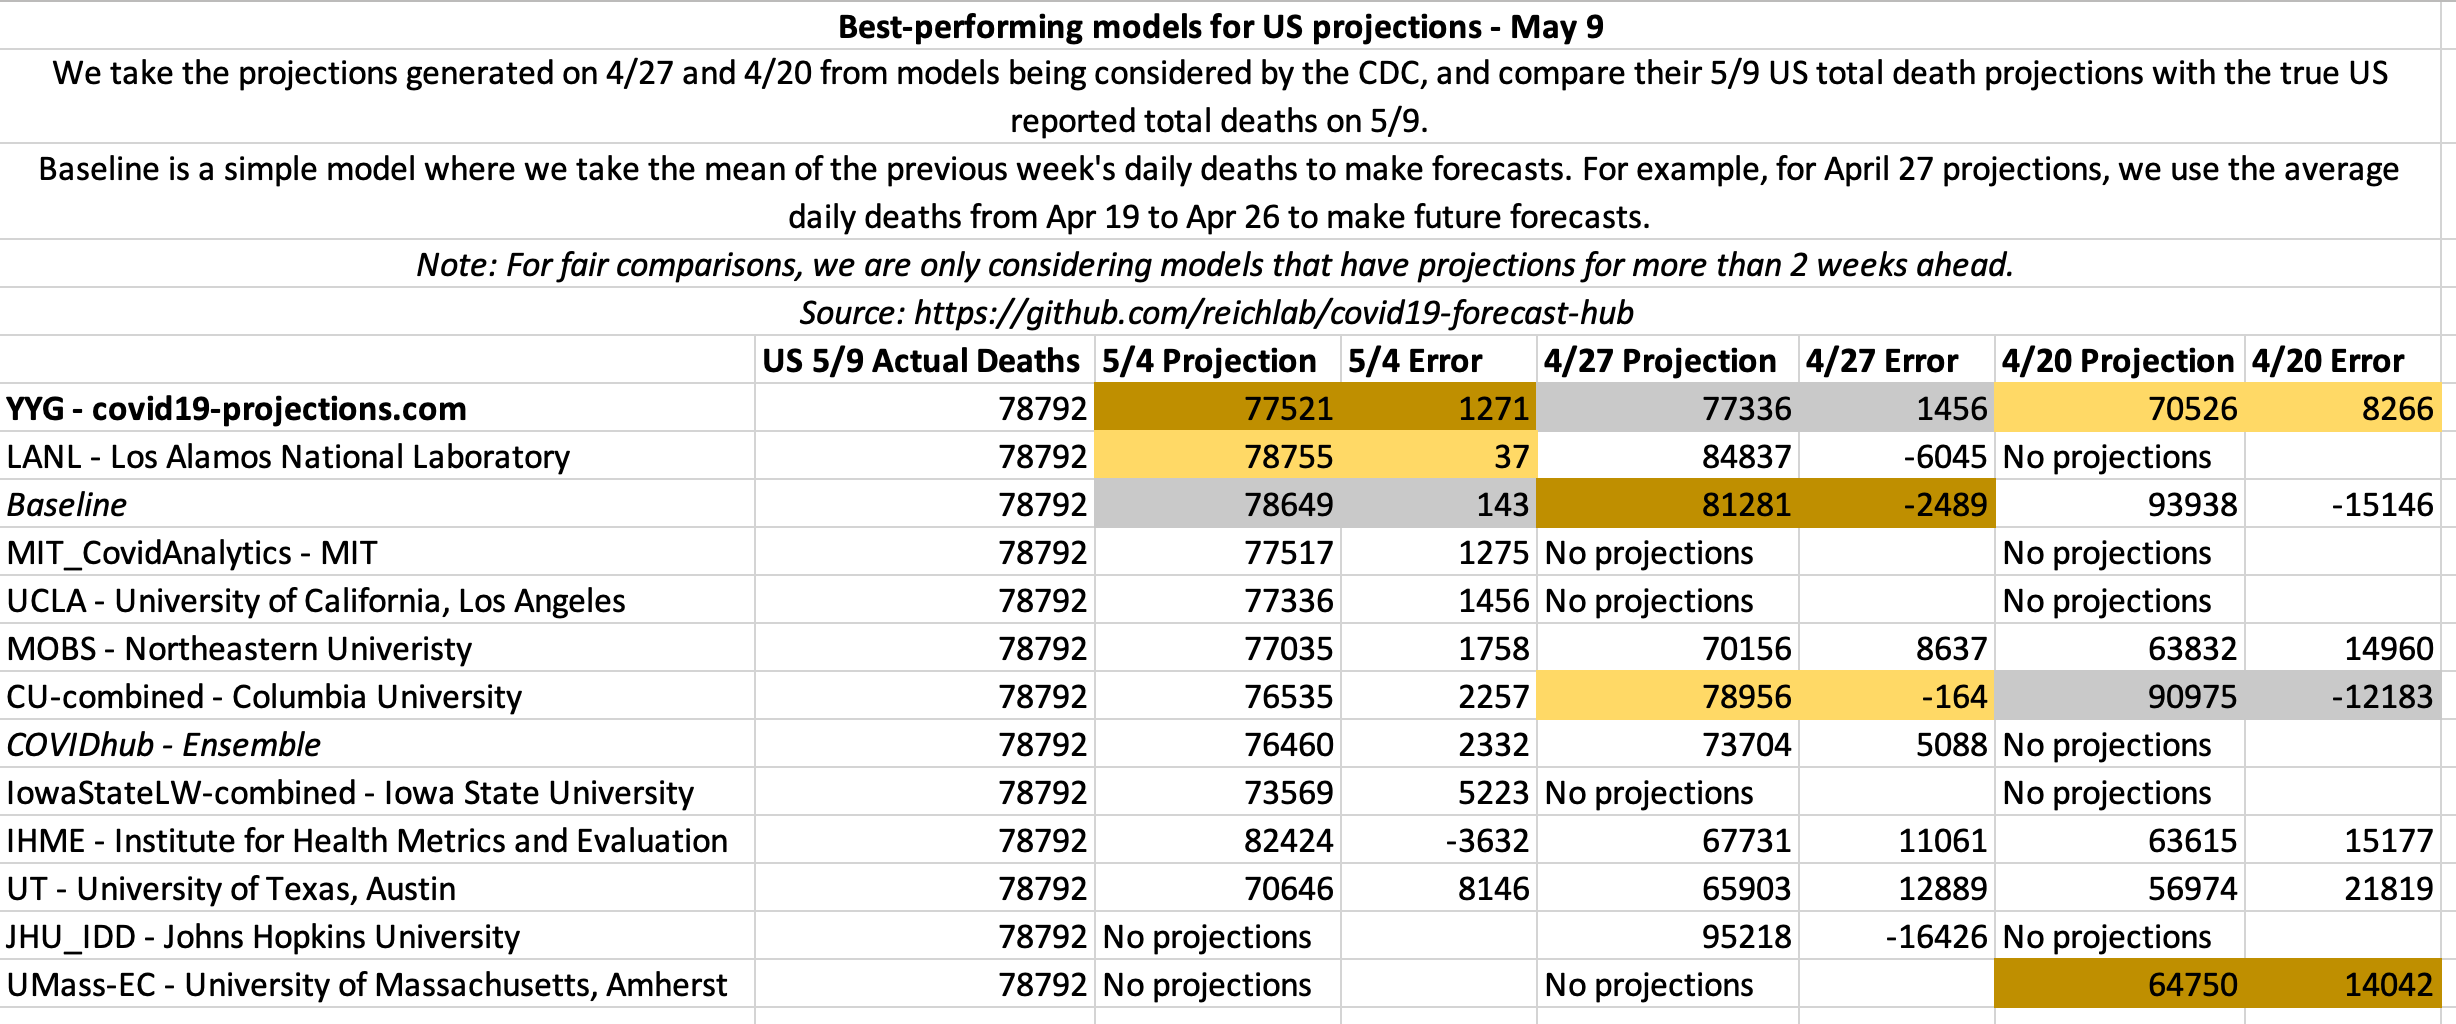
May 9
State-by-state projections
US projections
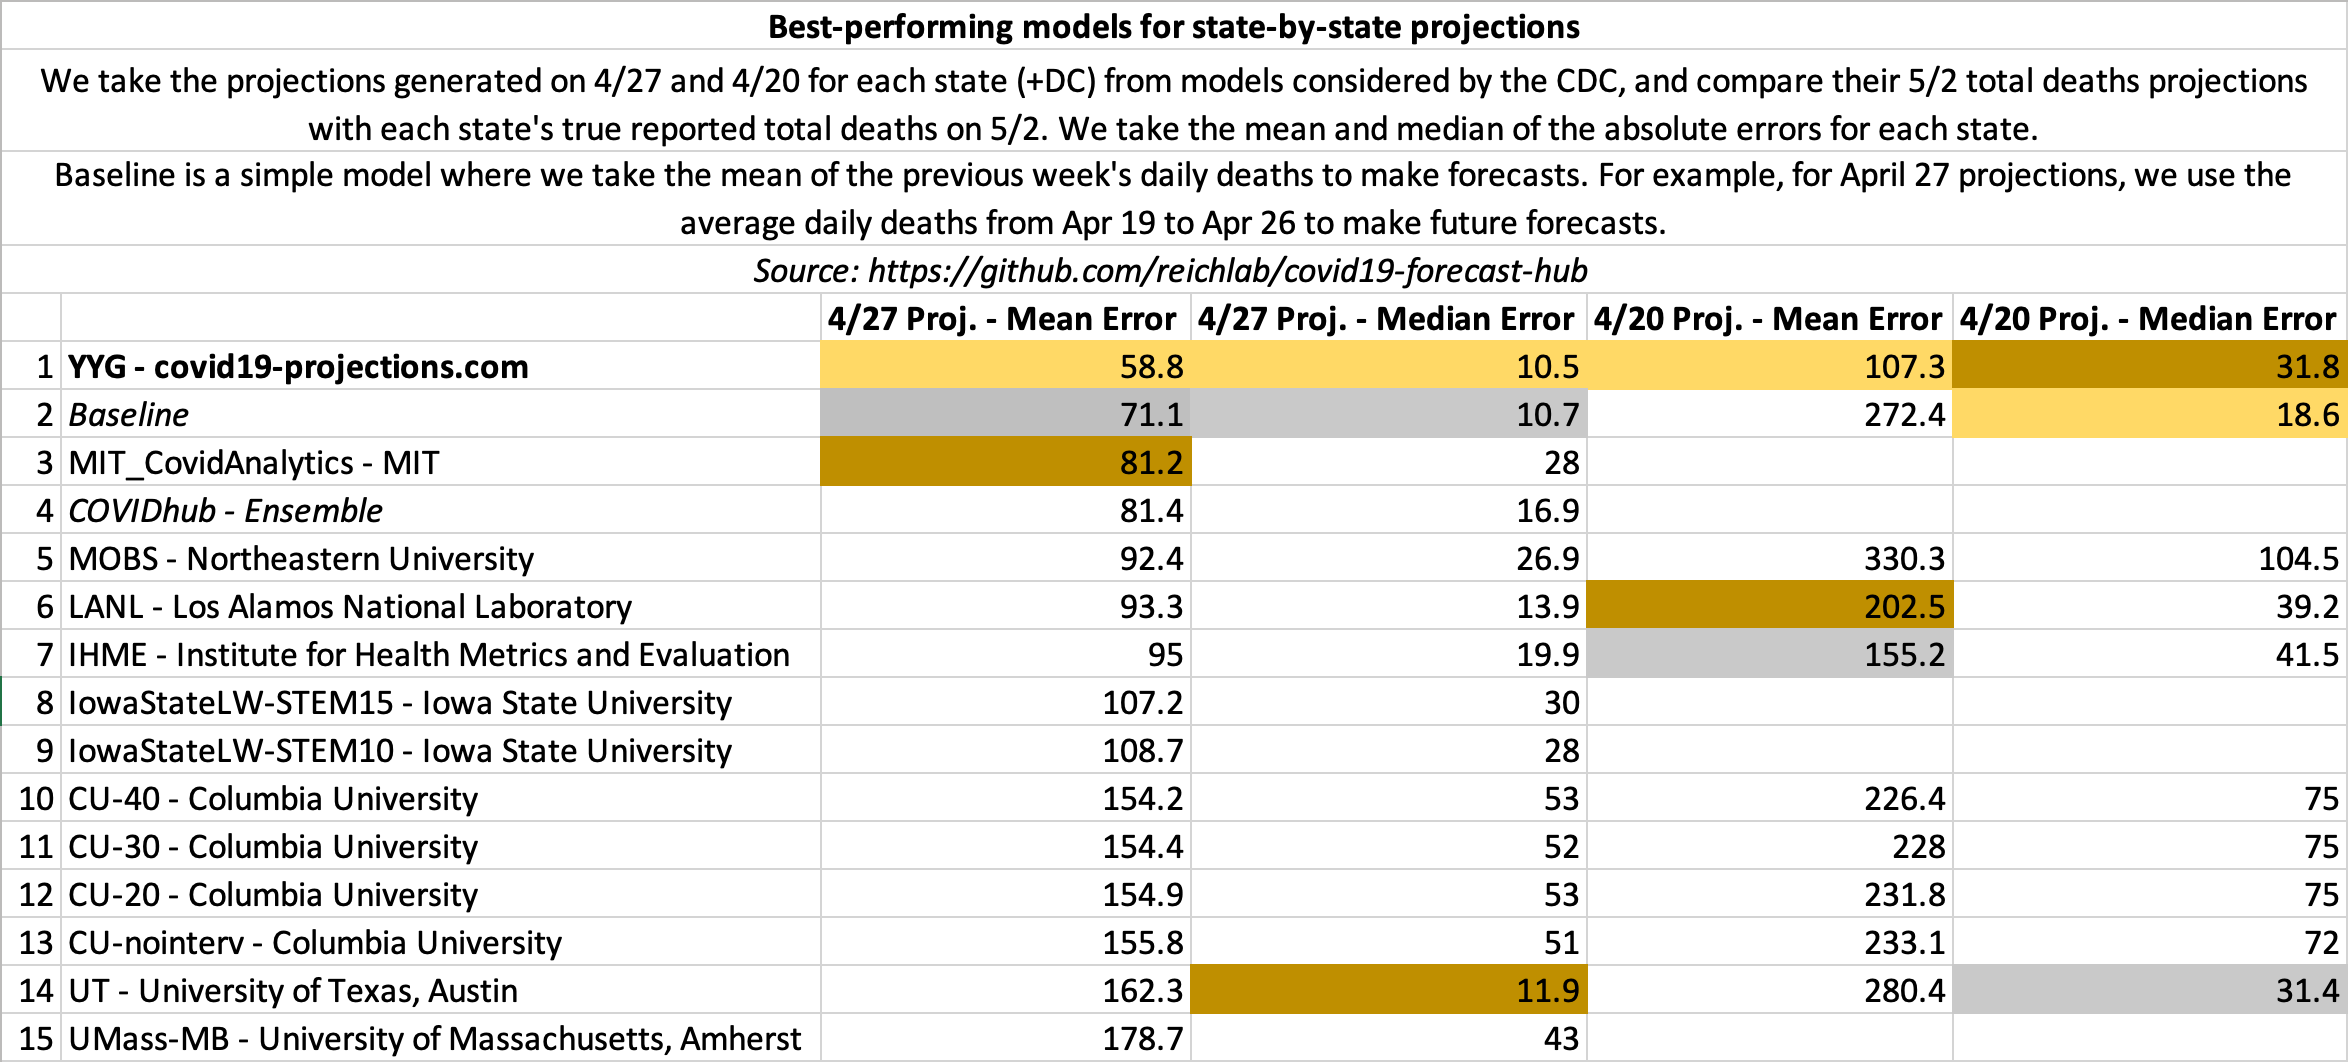
May 2
State-by-state projections
US projections